Chiến lược theo dõi xu hướng bộ lọc phạm vi kép
Tổng quan
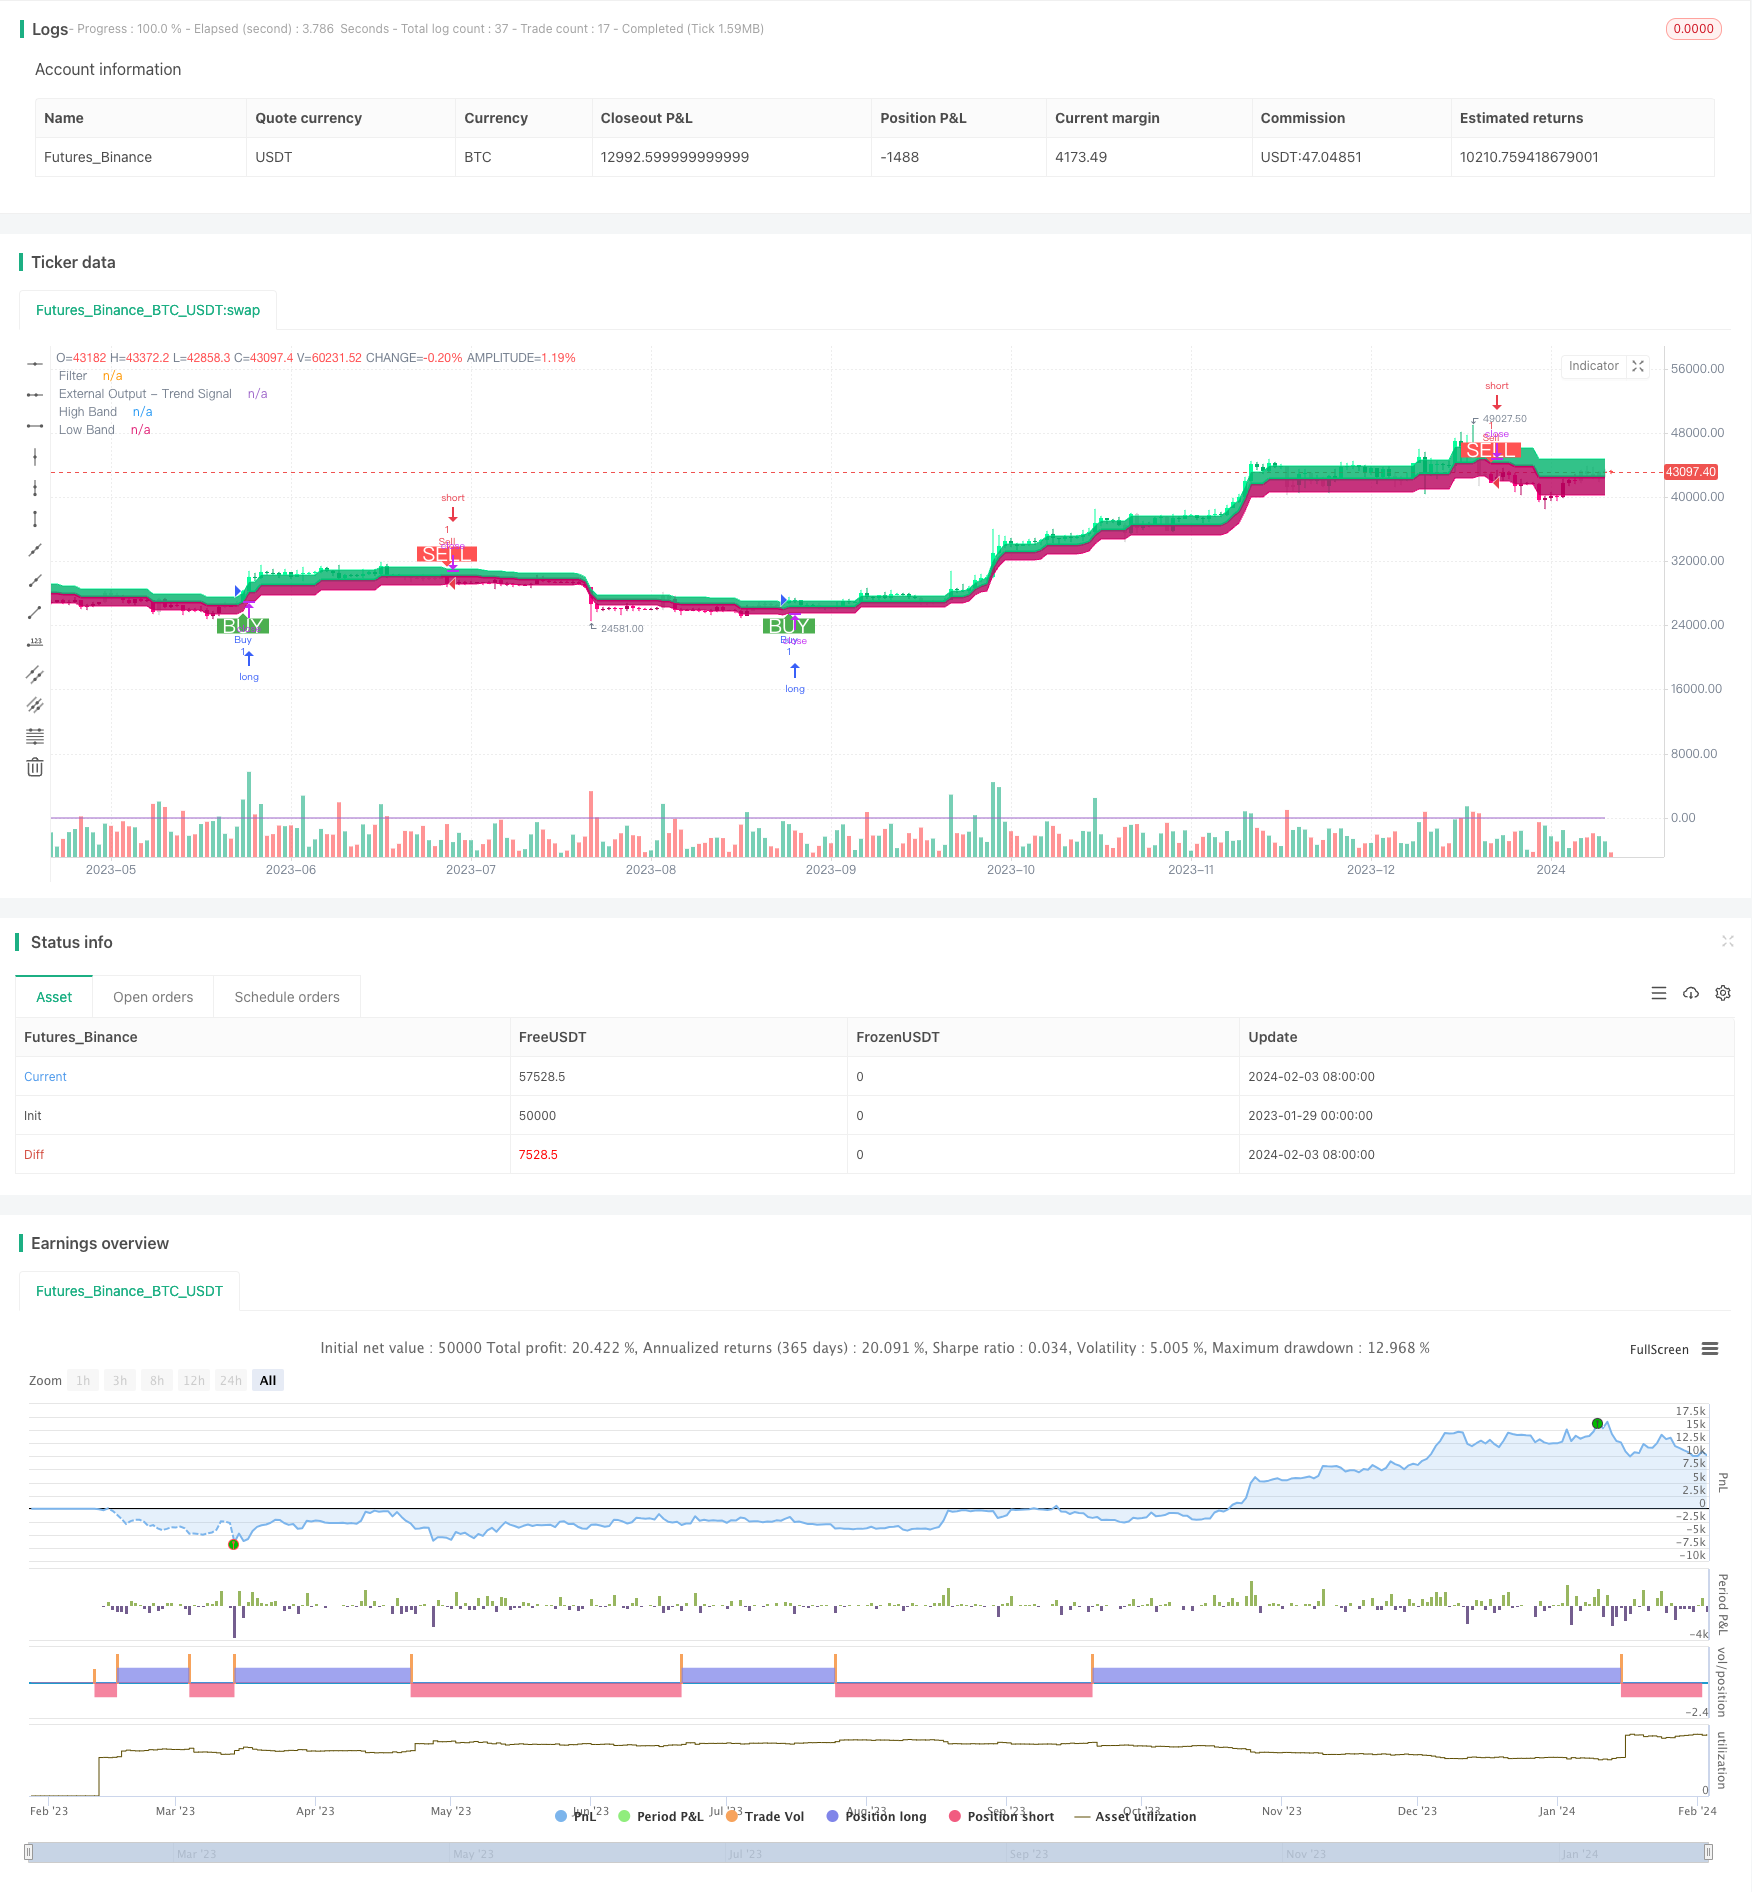
Chiến lược theo dõi xu hướng bộ lọc phạm vi kép (Dual Range Filter Trend Tracking Strategy) là một chiến lược giao dịch định lượng sử dụng bộ lọc phạm vi EMA kép để xác định hướng xu hướng và theo dõi xu hướng. Chiến lược này kết hợp bộ lọc đường hai và tính toán phạm vi ATR để xác định hiệu quả hướng xu hướng đường dài và trung bình và sử dụng theo dõi dừng lỗ để khóa lợi nhuận.
Nguyên tắc chiến lược
Trung tâm của chiến lược này là bộ lọc phạm vi EMA kép. Nó tính toán phạm vi ATR của đường K và làm mịn, sau đó kết hợp hai đường EMA để định vị vị trí của đường K trong phạm vi để xác định xem hiện tại có đang trong xu hướng hay không.
Cụ thể, chiến lược này tính toán kích thước phạm vi ATR của đường K trước tiên, sau đó kết hợp hai EMA để làm mịn đường. Phạm vi ATR đại diện cho phạm vi dao động bình thường của đường K. Khi giá vượt quá phạm vi này, điều đó có nghĩa là có sự thay đổi xu hướng.
Sau khi vào thị trường, chiến lược sử dụng lệnh dừng nổi để khóa lợi nhuận. Trong thời gian giữ vị trí, nó sẽ đánh giá trong thời gian thực liệu đường K có bị tụt ra ngoài phạm vi hay không, và sẽ thoát khỏi vị trí hiện tại nếu có sự tụt. Điều này có thể khóa lợi nhuận của giao dịch xu hướng một cách hiệu quả.
Phân tích lợi thế
Chiến lược theo dõi xu hướng lọc hai phạm vi kết hợp các lợi thế của bộ lọc đồng tuyến và tính toán phạm vi, có thể xác định chính xác hướng của xu hướng, tránh đi vào và ra ngoài thường xuyên trong thời gian chấn động. Các lợi thế cụ thể như sau:
- Sử dụng nguyên tắc ATR để xác định phạm vi biến động của đường K, tránh đi vào thị trường trong bối cảnh thị trường bất ổn
- Bộ lọc EMA kép tăng độ chính xác phán đoán và giảm tín hiệu giả
- Hạn chế biến động trong thời gian thực, có thể khóa lợi nhuận theo xu hướng hiệu quả
- Lập luận chiến lược đơn giản, rõ ràng, dễ hiểu và tối ưu hóa
Phân tích rủi ro
Chiến lược này cũng có một số rủi ro, chủ yếu tập trung vào các khía cạnh sau:
- Mức độ nhảy vọt lớn có thể phá vỡ phạm vi ATR, dẫn đến nhập cảnh sớm
- Trong một xu hướng mạnh mẽ, dừng lỗ có thể được kích hoạt quá sớm
- Thiết lập tham số không đúng cũng ảnh hưởng đến hiệu suất của chính sách
Những rủi ro này có thể được giải quyết bằng các phương pháp như tối ưu hóa các tham số, ngăn chặn phá vỡ giả và đánh giá cường độ của xu hướng.
Lời khuyên tối ưu hóa
Chiến lược theo dõi xu hướng lọc hai phạm vi cũng có tiềm năng tối ưu hóa hơn nữa, các hướng tối ưu hóa chính bao gồm:
- Tối ưu hóa tham số ATR, làm mịn phạm vi dao động của đường K
- Kết hợp với chỉ số khối lượng giao dịch để tránh phá vỡ giả
- Xác định cường độ của xu hướng, phân biệt giữa đột phá và xu hướng bền vững
- Tối ưu hóa điểm dừng lỗ, theo dõi xu hướng tăng trong khi đảm bảo lợi nhuận
Thông qua các tối ưu hóa này, chiến lược có thể đạt được lợi nhuận ổn định trong nhiều môi trường thị trường.
Tóm tắt
Chiến lược theo dõi xu hướng lọc hai phạm vi kết hợp nhiều ưu điểm của bộ lọc đường trung bình và phán đoán phạm vi ATR, có thể xác định hiệu quả hướng và thời gian nhập cảnh của xu hướng bền vững đường trung dài. Nó chỉ tham gia vào thị trường khi xu hướng thay đổi và sử dụng lỗ hổng nổi để khóa lợi nhuận.
/*backtest
start: 2023-01-29 00:00:00
end: 2024-02-04 00:00:00
period: 1d
basePeriod: 1h
exchanges: [{"eid":"Futures_Binance","currency":"BTC_USDT"}]
*/

//@version=4
strategy("Range Filter [DW] & Labels", shorttitle="RF [DW] & Labels", overlay=true)

//Conditional Sampling EMA Function
Cond_EMA(x, cond, n)=>
    var val     = array.new_float(0)
    var ema_val = array.new_float(1)
    if cond
        array.push(val, x)
        if array.size(val) > 1
            array.remove(val, 0)
        if na(array.get(ema_val, 0))
            array.fill(ema_val, array.get(val, 0))
        array.set(ema_val, 0, (array.get(val, 0) - array.get(ema_val, 0))*(2/(n + 1)) + array.get(ema_val, 0))
    EMA = array.get(ema_val, 0)
    EMA

//Conditional Sampling SMA Function
Cond_SMA(x, cond, n)=>
    var vals = array.new_float(0)
    if cond
        array.push(vals, x)
        if array.size(vals) > n
            array.remove(vals, 0)
    SMA = array.avg(vals)
    SMA

//Standard Deviation Function
Stdev(x, n)=>
    sqrt(Cond_SMA(pow(x, 2), 1, n) - pow(Cond_SMA(x, 1, n), 2))

//Range Size Function
rng_size(x, scale, qty, n)=>
    ATR      = Cond_EMA(tr(true), 1, n)
    AC       = Cond_EMA(abs(x - x[1]), 1, n)
    SD       = Stdev(x, n)
    rng_size = scale=="Pips" ? qty*0.0001 : scale=="Points" ? qty*syminfo.pointvalue : scale=="% of Price" ? close*qty/100 : scale=="ATR" ? qty*ATR :
               scale=="Average Change" ? qty*AC : scale=="Standard Deviation" ? qty*SD : scale=="Ticks" ? qty*syminfo.mintick : qty

//Two Type Range Filter Function
rng_filt(h, l, rng_, n, type, smooth, sn, av_rf, av_n)=>
    rng_smooth = Cond_EMA(rng_, 1, sn)
    r          = smooth ? rng_smooth : rng_
    var rfilt  = array.new_float(2, (h + l)/2)
    array.set(rfilt, 1, array.get(rfilt, 0))
    if type=="Type 1"
        if h - r > array.get(rfilt, 1)
            array.set(rfilt, 0, h - r)
        if l + r < array.get(rfilt, 1)
            array.set(rfilt, 0, l + r)
    if type=="Type 2"
        if h >= array.get(rfilt, 1) + r
            array.set(rfilt, 0, array.get(rfilt, 1) + floor(abs(h - array.get(rfilt, 1))/r)*r)
        if l <= array.get(rfilt, 1) - r
            array.set(rfilt, 0, array.get(rfilt, 1) - floor(abs(l - array.get(rfilt, 1))/r)*r)
    rng_filt1 = array.get(rfilt, 0)
    hi_band1  = rng_filt1 + r
    lo_band1  = rng_filt1 - r
    rng_filt2 = Cond_EMA(rng_filt1, rng_filt1 != rng_filt1[1], av_n)
    hi_band2  = Cond_EMA(hi_band1, rng_filt1 != rng_filt1[1], av_n)
    lo_band2  = Cond_EMA(lo_band1, rng_filt1 != rng_filt1[1], av_n)
    rng_filt  = av_rf ? rng_filt2 : rng_filt1
    hi_band   = av_rf ? hi_band2 : hi_band1
    lo_band   = av_rf ? lo_band2 : lo_band1
    [hi_band, lo_band, rng_filt]

//-----------------------------------------------------------------------------------------------------------------------------------------------------------------
//Inputs
//-----------------------------------------------------------------------------------------------------------------------------------------------------------------

//Filter Type
f_type = input(defval="Type 1", options=["Type 1", "Type 2"], title="Filter Type")

//Movement Source
mov_src = input(defval="Close", options=["Wicks", "Close"], title="Movement Source")

//Range Size Inputs
rng_qty   = input(defval=2.618, minval=0.0000001, title="Range Size")
rng_scale = input(defval="Average Change", options=["Points", "Pips", "Ticks", "% of Price", "ATR", "Average Change", "Standard Deviation", "Absolute"], title="Range Scale")

//Range Period
rng_per = input(defval=14, minval=1, title="Range Period (for ATR, Average Change, and Standard Deviation)")

//Range Smoothing Inputs
smooth_range = input(defval=true, title="Smooth Range")
smooth_per   = input(defval=27, minval=1, title="Smoothing Period")

//Filter Value Averaging Inputs
av_vals    = input(defval=true, title="Average Filter Changes")
av_samples = input(defval=2, minval=1, title="Number Of Changes To Average")

// New inputs for take profit and stop loss
take_profit_percent = input(defval=100.0, minval=0.1, maxval=1000.0, title="Take Profit Percentage", step=0.1)
stop_loss_percent = input(defval=100, minval=0.1, maxval=1000.0, title="Stop Loss Percentage", step=0.1)

//-----------------------------------------------------------------------------------------------------------------------------------------------------------------
//Definitions
//-----------------------------------------------------------------------------------------------------------------------------------------------------------------

//High And Low Values
h_val = mov_src=="Wicks" ? high : close
l_val = mov_src=="Wicks" ? low : close

//Range Filter Values
[h_band, l_band, filt] = rng_filt(h_val, l_val, rng_size((h_val + l_val)/2, rng_scale, rng_qty, rng_per), rng_per, f_type, smooth_range, smooth_per, av_vals, av_samples)

//Direction Conditions
var fdir = 0.0
fdir    := filt > filt[1] ? 1 : filt < filt[1] ? -1 : fdir
upward   = fdir==1 ? 1 : 0
downward = fdir==-1 ? 1 : 0

//Colors
filt_color = upward ? #05ff9b : downward ? #ff0583 : #cccccc
bar_color  = upward and (close > filt) ? (close > close[1] ? #05ff9b : #00b36b) :
             downward and (close < filt) ? (close < close[1] ? #ff0583 : #b8005d) : #cccccc

//-----------------------------------------------------------------------------------------------------------------------------------------------------------------
//Outputs
//-----------------------------------------------------------------------------------------------------------------------------------------------------------------

//Filter Plot
filt_plot = plot(filt, color=filt_color, transp=0, linewidth=3,  title="Filter")

//Band Plots
h_band_plot = plot(h_band, color=#05ff9b, transp=100, title="High Band")
l_band_plot = plot(l_band, color=#ff0583, transp=100, title="Low Band")

//Band Fills
fill(h_band_plot, filt_plot, color=#00b36b, transp=85, title="High Band Fill")
fill(l_band_plot, filt_plot, color=#b8005d, transp=85, title="Low Band Fill")

//Bar Color
barcolor(bar_color)

//External Trend Output
plot(fdir, transp=100, editable=false, display=display.none, title="External Output - Trend Signal")

// Trading Conditions Logic
longCond = close > filt and close > close[1] and upward > 0 or close > filt and close < close[1] and upward > 0
shortCond = close < filt and close < close[1] and downward > 0 or close < filt and close > close[1] and downward > 0

CondIni = 0
CondIni := longCond ? 1 : shortCond ? -1 : CondIni[1]
longCondition = longCond and CondIni[1] == -1
shortCondition = shortCond and CondIni[1] == 1

// Strategy Entry and Exit
strategy.entry("Buy", strategy.long, when = longCondition)
strategy.entry("Sell", strategy.short, when = shortCondition)

// New: Close conditions based on percentage change
long_take_profit_condition = close > strategy.position_avg_price * (1 + take_profit_percent / 100)
short_take_profit_condition = close < strategy.position_avg_price * (1 - take_profit_percent / 100)

long_stop_loss_condition = close < strategy.position_avg_price * (1 - stop_loss_percent / 100)
short_stop_loss_condition = close > strategy.position_avg_price * (1 + stop_loss_percent / 100)

strategy.close("Buy", when = shortCondition or long_take_profit_condition or long_stop_loss_condition)
strategy.close("Sell", when = longCondition or short_take_profit_condition or short_stop_loss_condition)

// Plot Buy and Sell Labels
plotshape(longCondition, title = "Buy Signal", text ="BUY", textcolor = color.white, style=shape.labelup, size = size.normal, location=location.belowbar, color = color.green, transp = 0)
plotshape(shortCondition, title = "Sell Signal", text ="SELL", textcolor = color.white, style=shape.labeldown, size = size.normal, location=location.abovebar, color = color.red, transp = 0)

// Alerts
alertcondition(longCondition, title="Buy Alert", message = "BUY")
alertcondition(shortCondition, title="Sell Alert", message = "SELL")