Chiến lược dừng lỗ theo đường trung bình động kép
Tổng quan
Chiến lược này tạo ra tín hiệu mua khi đường nhanh đi qua đường chậm bằng cách tính toán trung bình di chuyển của hai tham số khác nhau. Đồng thời sử dụng phạm vi biến động thực tế trung bình để tính toán giá dừng để theo dõi giá dừng và tạo ra tín hiệu bán khi giá giảm xuống giá dừng. Chiến lược này có thể theo dõi hiệu quả xu hướng thị trường và dừng lại kịp thời sau khi kiếm được lợi nhuận.
Nguyên tắc chiến lược
- Đường trung bình di chuyển nhanh ((EMA): tham số là đường trung bình di chuyển chỉ số 12 ngày, có thể phản ứng nhanh với sự thay đổi giá.
- Trung bình di chuyển chậm ((SMA): tham số là trung bình di chuyển đơn giản 45 ngày, biểu thị xu hướng dài hạn.
- Một tín hiệu mua được tạo ra khi một đường đi qua đường đi chậm trên đường trung bình di chuyển nhanh.
- Tính trung bình biến động thực tế trong 15 ngày (ATR) được sử dụng như một chuẩn dừng lỗ.
- Đặt theo dõi mức dừng lỗ theo giá trị ATR (ví dụ: 6 lần ATR) và cập nhật giá dừng lỗ trong thời gian thực.
- Một tín hiệu bán ra được tạo ra khi giá thấp hơn giá dừng lỗ.
Chiến lược này kết hợp theo dõi xu hướng và quản lý lỗ hổng, có thể theo dõi hướng đường dài trung bình và kiểm soát tổn thất đơn lẻ bằng cách dừng lỗ.
Phân tích lợi thế
- Sự kết hợp của các đường trung bình di chuyển có thể giúp xác định xu hướng hiệu quả, tăng độ tin cậy của tín hiệu.
- Động thái theo dõi dừng lỗ có thể dừng lỗ kịp thời, tránh tấn công sức mạnh tài chính.
- Kết hợp với ATR, Stop Loss làm cho giá Stop Loss hợp lý và tránh quá nhạy cảm.
- Các chiến lược được xây dựng rõ ràng và dễ hiểu, các tham số được điều chỉnh linh hoạt.
Phân tích rủi ro
- Đường trung bình di chuyển bị chậm trễ, có thể bỏ lỡ cơ hội rút ngắn.
- Lạm phát quá mức có thể làm giảm lợi nhuận.
- Lệnh dừng quá nhạy cảm sẽ làm tăng tần suất giao dịch và gánh nặng phí.
- Sự biến động của tỷ lệ cổ phiếu có thể ảnh hưởng đến sự ổn định của tham số ATR.
Các tham số trung bình di chuyển có thể được tối ưu hóa thích hợp, hoặc điều chỉnh ATR để cân bằng mức độ dừng lỗ. Các chỉ số khác cũng có thể được kết hợp với các điều kiện lọc để cải thiện thời gian nhập cảnh.
Hướng tối ưu hóa
- Kiểm tra nhiều hơn các kết hợp tham số để chọn trung bình di chuyển tốt nhất.
- Điều chỉnh tham số nhân của ATR dừng lỗ theo đặc điểm của các cổ phiếu khác nhau.
- Thêm các điều kiện lọc như chỉ số giá cả, tránh giao dịch không cần thiết.
- Lưu trữ nhiều dữ liệu lịch sử hơn để kiểm tra tính ổn định của tham số.
Tóm tắt
Chiến lược này thành công trong việc kết hợp theo dõi xu hướng của trung bình di chuyển và dừng động ATR, có thể thích ứng với các đặc điểm khác nhau của cổ phiếu thông qua tối ưu hóa tham số. Chiến lược này tạo ra ranh giới mua và dừng rõ ràng, làm cho logic giao dịch đơn giản và rõ ràng.
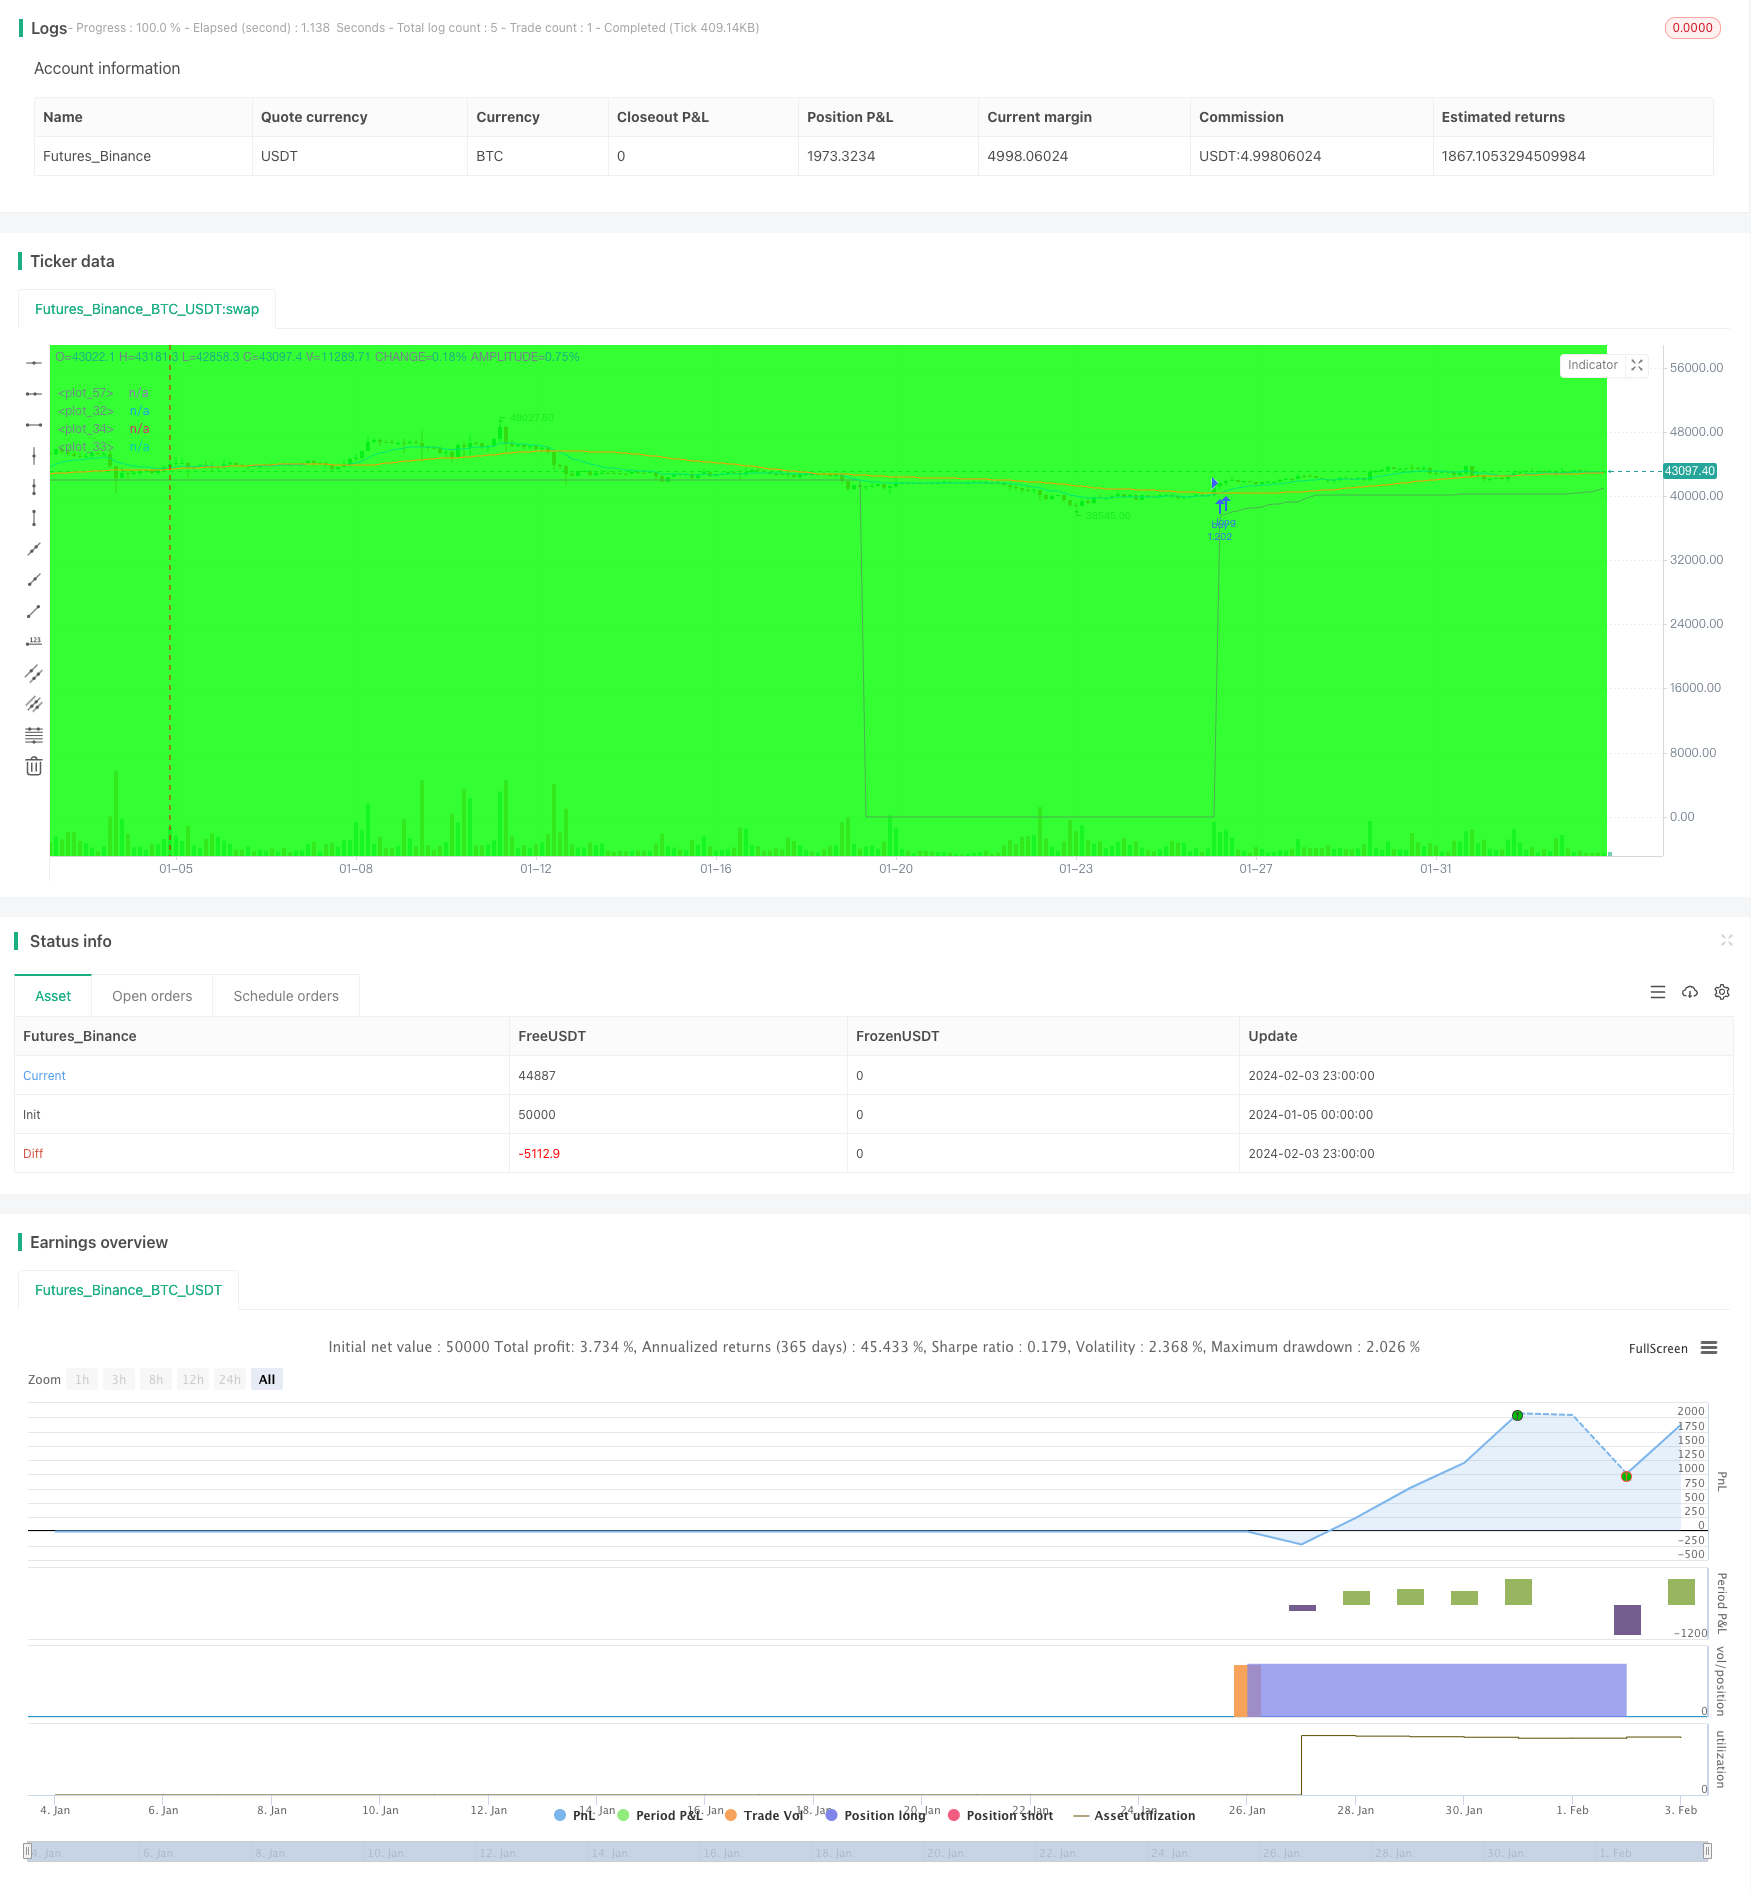
/*backtest
start: 2024-01-05 00:00:00
end: 2024-02-04 00:00:00
period: 3h
basePeriod: 15m
exchanges: [{"eid":"Futures_Binance","currency":"BTC_USDT"}]
*/

//@version=2
//created by XPloRR 24-02-2018

strategy("XPloRR MA-Buy ATR-MA-Trailing-Stop Strategy",overlay=true, initial_capital=1000,default_qty_type=strategy.percent_of_equity,default_qty_value=100)

testStartYear = input(2005, "Start Year")
testStartMonth = input(1, "Start Month")
testStartDay = input(1, "Start Day")
testPeriodStart = timestamp(testStartYear,testStartMonth,testStartDay,0,0)

testStopYear = input(2050, "Stop Year")
testStopMonth = input(12, "Stop Month")
testStopDay = input(31, "Stop Day")
testPeriodStop = timestamp(testStopYear,testStopMonth,testStopDay,0,0)

testPeriodBackground = input(title="Background", type=bool, defval=true)
testPeriodBackgroundColor = testPeriodBackground and (time >= testPeriodStart) and (time <= testPeriodStop) ? #00FF00 : na
bgcolor(testPeriodBackgroundColor, transp=97)

emaPeriod = input(12, "Exponential MA")
smaPeriod = input(45, "Simple MA")
stopPeriod = input(12, "Stop EMA")
delta = input(6, "Trailing Stop #ATR")

testPeriod() => true

emaval=ema(close,emaPeriod)
smaval=sma(close,smaPeriod)
stopval=ema(close,stopPeriod)
atr=sma((high-low),15)

plot(emaval, color=blue,linewidth=1)
plot(smaval, color=orange,linewidth=1)
plot(stopval, color=lime,linewidth=1)

long=crossover(emaval,smaval)
short=crossunder(emaval,smaval)

//buy-sell signal
stop=0
inlong=0
if testPeriod()
    if (long and (not inlong[1]))
        strategy.entry("buy",strategy.long)
        inlong:=1
        stop:=emaval-delta*atr
    else
        stop:=iff((nz(emaval)>(nz(stop[1])+delta*atr))and(inlong[1]),emaval-delta*atr,nz(stop[1]))
        inlong:=nz(inlong[1])
        if ((stopval<stop) and (inlong[1]))
            strategy.close("buy")
            inlong:=0
            stop:=0
else
    inlong:=0
    stop:=0
plot(stop,color=green,linewidth=1)