Chiến lược theo dõi xu hướng giao cắt trung bình động
Tổng quan
Chiến lược theo dõi xu hướng chéo đường trung bình di chuyển là một chiến lược giao dịch định lượng theo dõi xu hướng thị trường. Chiến lược này tạo ra tín hiệu giao dịch bằng cách tính toán đường trung bình di chuyển nhanh và đường trung bình di chuyển chậm và bắt điểm biến của xu hướng thị trường khi chúng xảy ra.
Nguyên tắc chiến lược
Nguyên tắc cốt lõi của chiến lược này là sử dụng các tham số khác nhau để đánh giá xu hướng thị trường của đường trung bình di chuyển chỉ số ((EMA)). Chiến lược xác định một EMA nhanh và một EMA chậm. Khi EMA nhanh đi qua EMA chậm từ phía dưới, thị trường sẽ chuyển sang bull; khi EMA nhanh đi qua EMA chậm từ phía trên xuống, thị trường sẽ chuyển sang bear.
Chiến lược sẽ mở nhiều thẻ khi lên và mở trống khi xuống. Chiến lược sẽ giữ vị trí cho đến khi stop loss được kích hoạt hoặc tín hiệu đảo ngược chéo xảy ra một lần nữa.
Phân tích lợi thế
Chiến lược này có những ưu điểm sau:
- Lập luận của chiến lược đơn giản, rõ ràng, dễ hiểu và thích hợp cho người mới bắt đầu;
- Sử dụng EMA để làm mịn giá, có thể lọc hiệu quả tiếng ồn thị trường và nhận ra xu hướng;
- Có thể điều chỉnh các tham số một cách linh hoạt để phù hợp với thị trường theo chu kỳ khác nhau;
- Có thể mở rộng chiến lược thành các phiên bản chu kỳ thời gian đa dạng để tăng tính ổn định.
Phân tích rủi ro
Chiến lược này cũng có một số rủi ro:
- Trong một tình huống chấn động, có thể xảy ra nhiều lần dừng lỗ, ảnh hưởng đến lợi nhuận;
- Không có khả năng xác định hiệu quả các loại xu hướng (bull or bear), có thể gây thiệt hại nghiêm trọng;
- Các tham số EMA được thiết lập không chính xác, có thể dẫn đến tần suất giao dịch quá cao hoặc nhận dạng chậm.
Để giảm rủi ro, bạn có thể xem xét kết hợp các chỉ số khác để xác định loại xu hướng hoặc đặt tỷ lệ dừng lỗ lỏng lẻo hơn.
Hướng tối ưu hóa
Chiến lược này cũng có thể được tối ưu hóa theo các khía cạnh sau:
- Tăng khả năng đánh giá các loại xu hướng và tránh mở các vị thế đảo ngược;
- Tăng khả năng phân tích thời gian, cải thiện chất lượng tín hiệu;
- Động thái điều chỉnh tỷ lệ dừng lỗ, tối ưu hóa điểm thoát;
- Kết hợp với các chỉ số khác để lọc tín hiệu và giảm sai sót giao dịch.
Tóm tắt
Chiến lược theo dõi xu hướng chéo đường trung bình di động là một chiến lược giao dịch xu hướng đơn giản và thực tế. Ý tưởng cốt lõi của chiến lược này rõ ràng, dễ thực hành, đồng thời có một số không gian tối ưu hóa. Bằng cách điều chỉnh tham số, phán đoán nhiều chu kỳ, dừng lỗ động, và các cách khác, bạn có thể liên tục nâng cao sự ổn định và lợi nhuận của chiến lược.
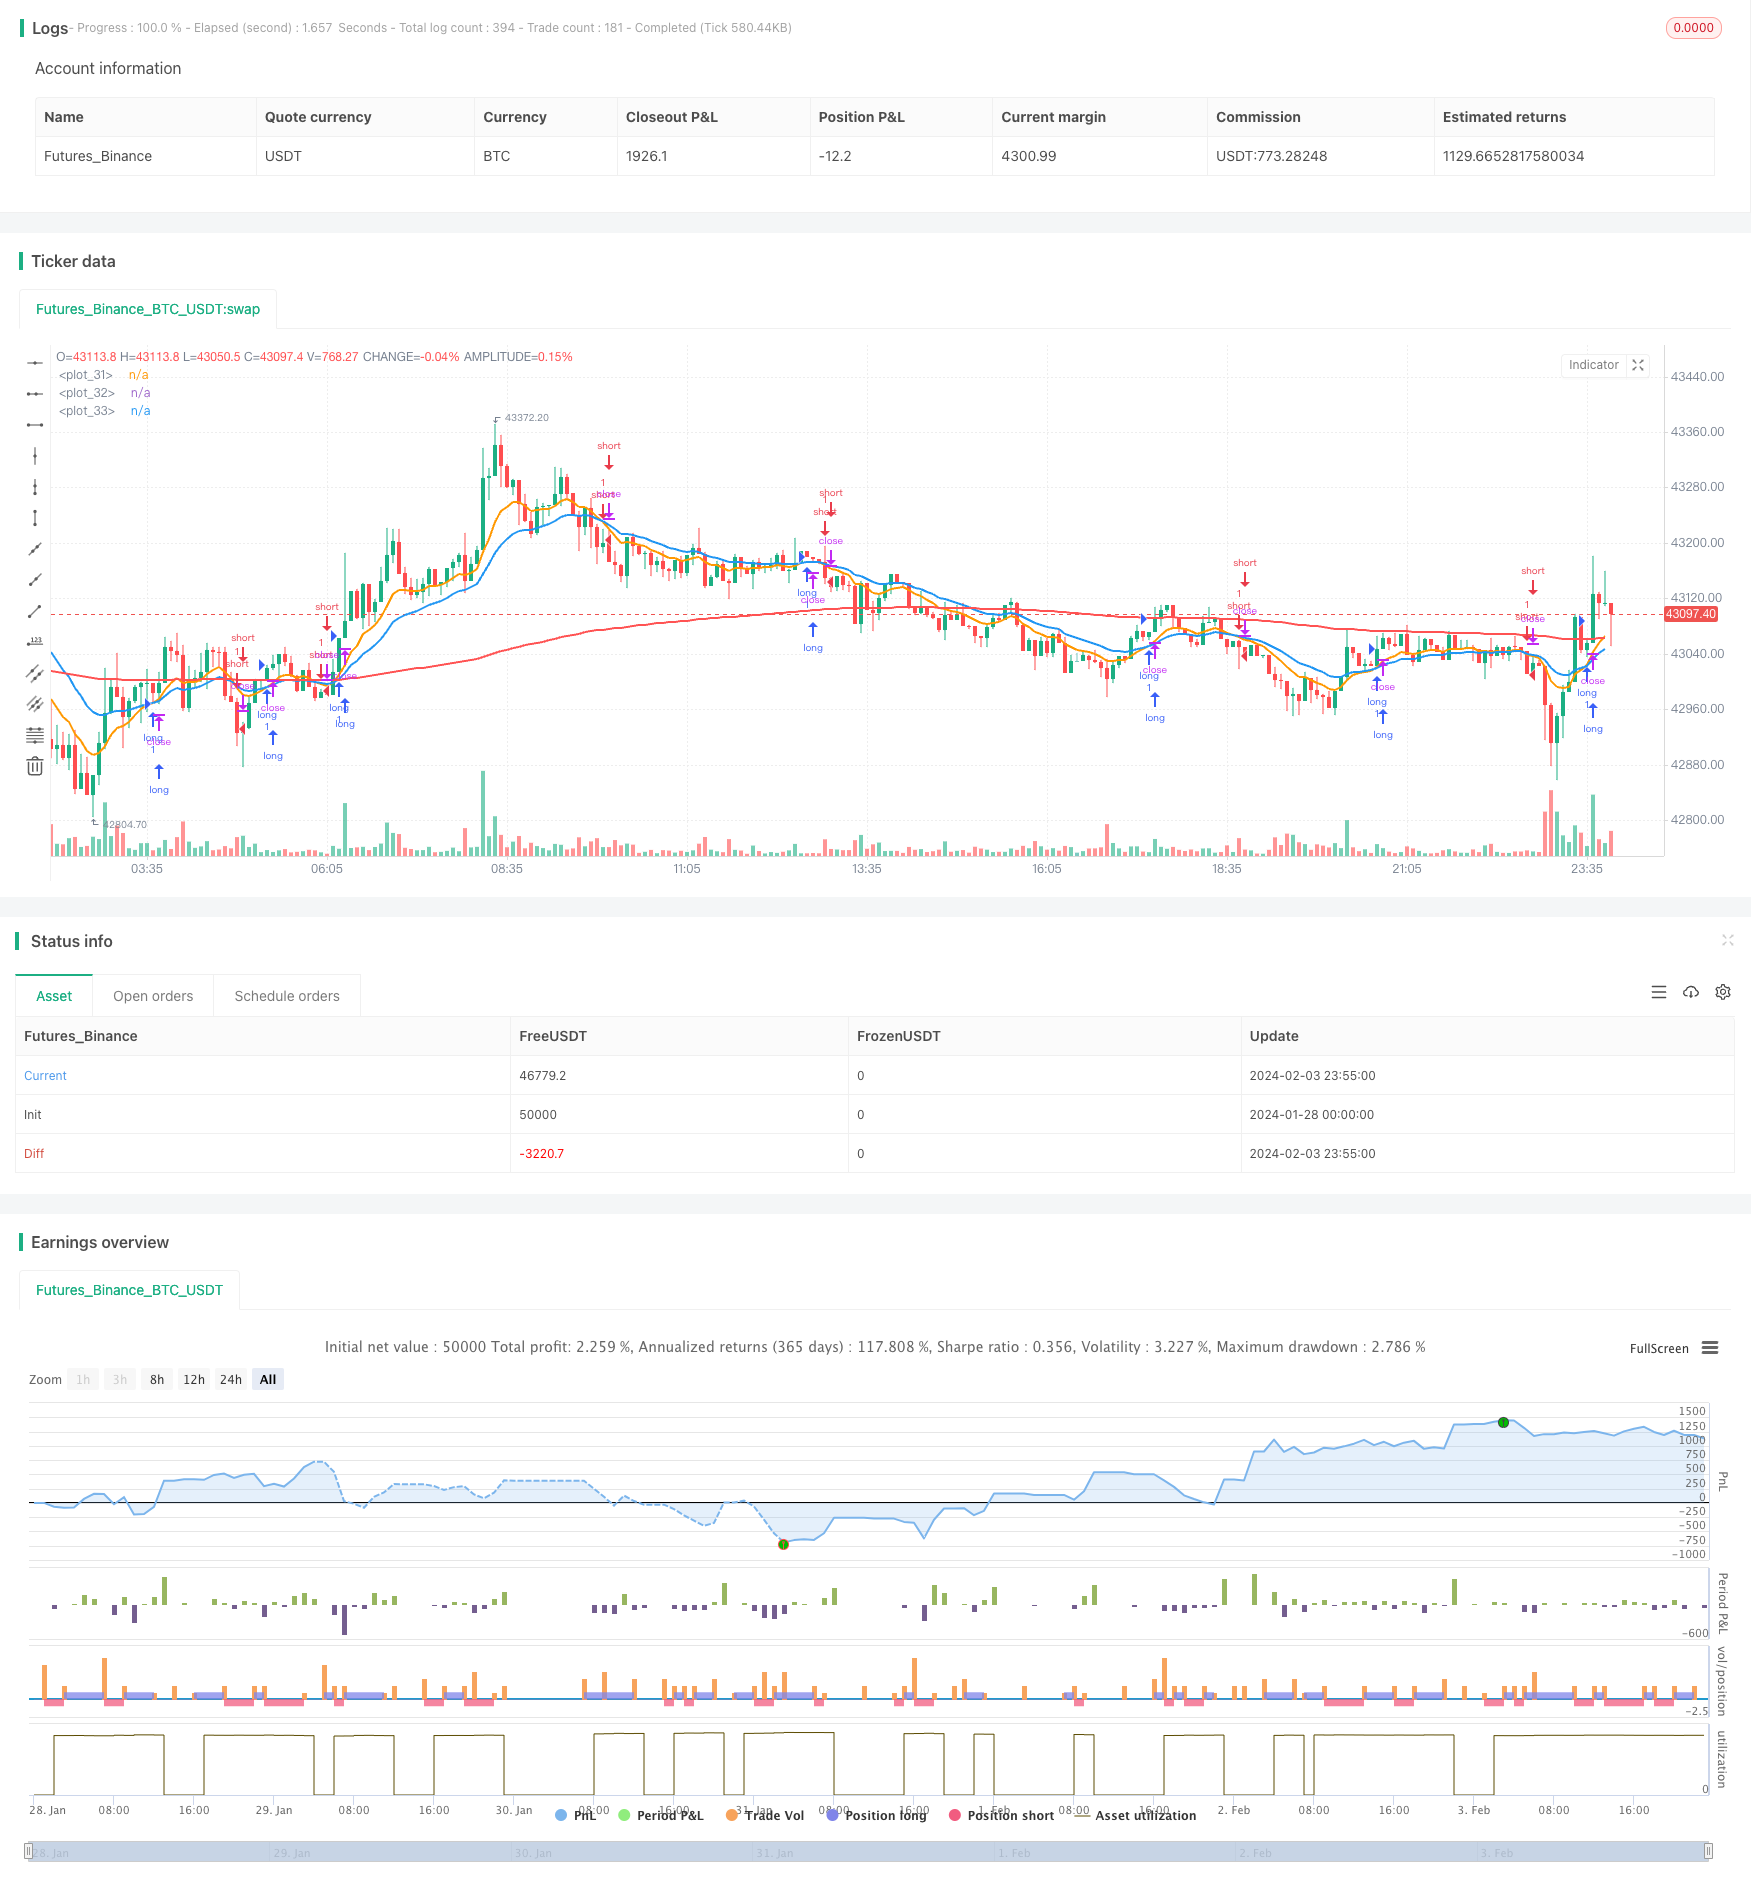
/*backtest
start: 2024-01-28 00:00:00
end: 2024-02-04 00:00:00
period: 5m
basePeriod: 1m
exchanges: [{"eid":"Futures_Binance","currency":"BTC_USDT"}]
*/

//@version=5
strategy('Zhukov trade', overlay=true, calc_on_every_tick=true, currency=currency.USD)

// INPUT:

// Options to enter fast and slow Exponential Moving Average (EMA) values
emaFast = input.int(title='Fast EMA', defval=10, minval=1, maxval=9999)
emaSlow = input.int(title='Slow EMA', defval=20, minval=1, maxval=9999)

// Option to select trade directions
tradeDirection = input.string(title='Trade Direction', options=['Long', 'Short', 'Both'], defval='Both')

// Options that configure the backtest date range
startDate = input(title='Start Date', defval=timestamp('01 Jan 2023 00:00'))
endDate = input(title='End Date', defval=timestamp('31 Dec 2030 23:59'))

// Set take profit and stop loss percentages
take_profit_percent = input(1.0, title ="Take Profit Percent") / 100.0
stop_loss_percent = input(1.0, title ="Stop Loss Percent") / 100.0

// CALCULATIONS:

// Use the built-in function to calculate two EMA lines
fastEMA = ta.ema(close, emaFast)
slowEMA = ta.ema(close, emaSlow)
emapos = ta.ema(close, 200)

// PLOT:

// Draw the EMA lines on the chart
plot(series=fastEMA, color=color.new(color.orange, 0), linewidth=2)
plot(series=slowEMA, color=color.new(color.blue, 0), linewidth=2)
plot(series=emapos, color=color.new(color.red, 0), linewidth=2)

// CONDITIONS:

// Check if the close time of the current bar falls inside the date range
inDateRange = true

// Translate input into trading conditions
longOK = tradeDirection == 'Long' or tradeDirection == 'Both'
shortOK = tradeDirection == 'Short' or tradeDirection == 'Both'

// Decide if we should go long or short using the built-in functions
longCondition = ta.crossover(fastEMA, slowEMA) and inDateRange
shortCondition = ta.crossunder(fastEMA, slowEMA) and inDateRange

// ORDERS:

// Submit entry (or reverse) orders
if longCondition and longOK
    strategy.entry(id='long', direction=strategy.long)

if shortCondition and shortOK
    strategy.entry(id='short', direction=strategy.short)

// Exit orders
if strategy.position_size > 0 and longOK
    strategy.exit(id='exit long', from_entry='long', limit=strategy.position_avg_price * (1 + take_profit_percent), stop=strategy.position_avg_price * (1 - stop_loss_percent))

if strategy.position_size < 0 and shortOK
    strategy.exit(id='exit short', from_entry='short', limit=strategy.position_avg_price * (1 - take_profit_percent), stop=strategy.position_avg_price * (1 + stop_loss_percent))