Chiến lược động lượng đột phá dựa trên đường trung bình động chữ thập vàng
Tổng quan
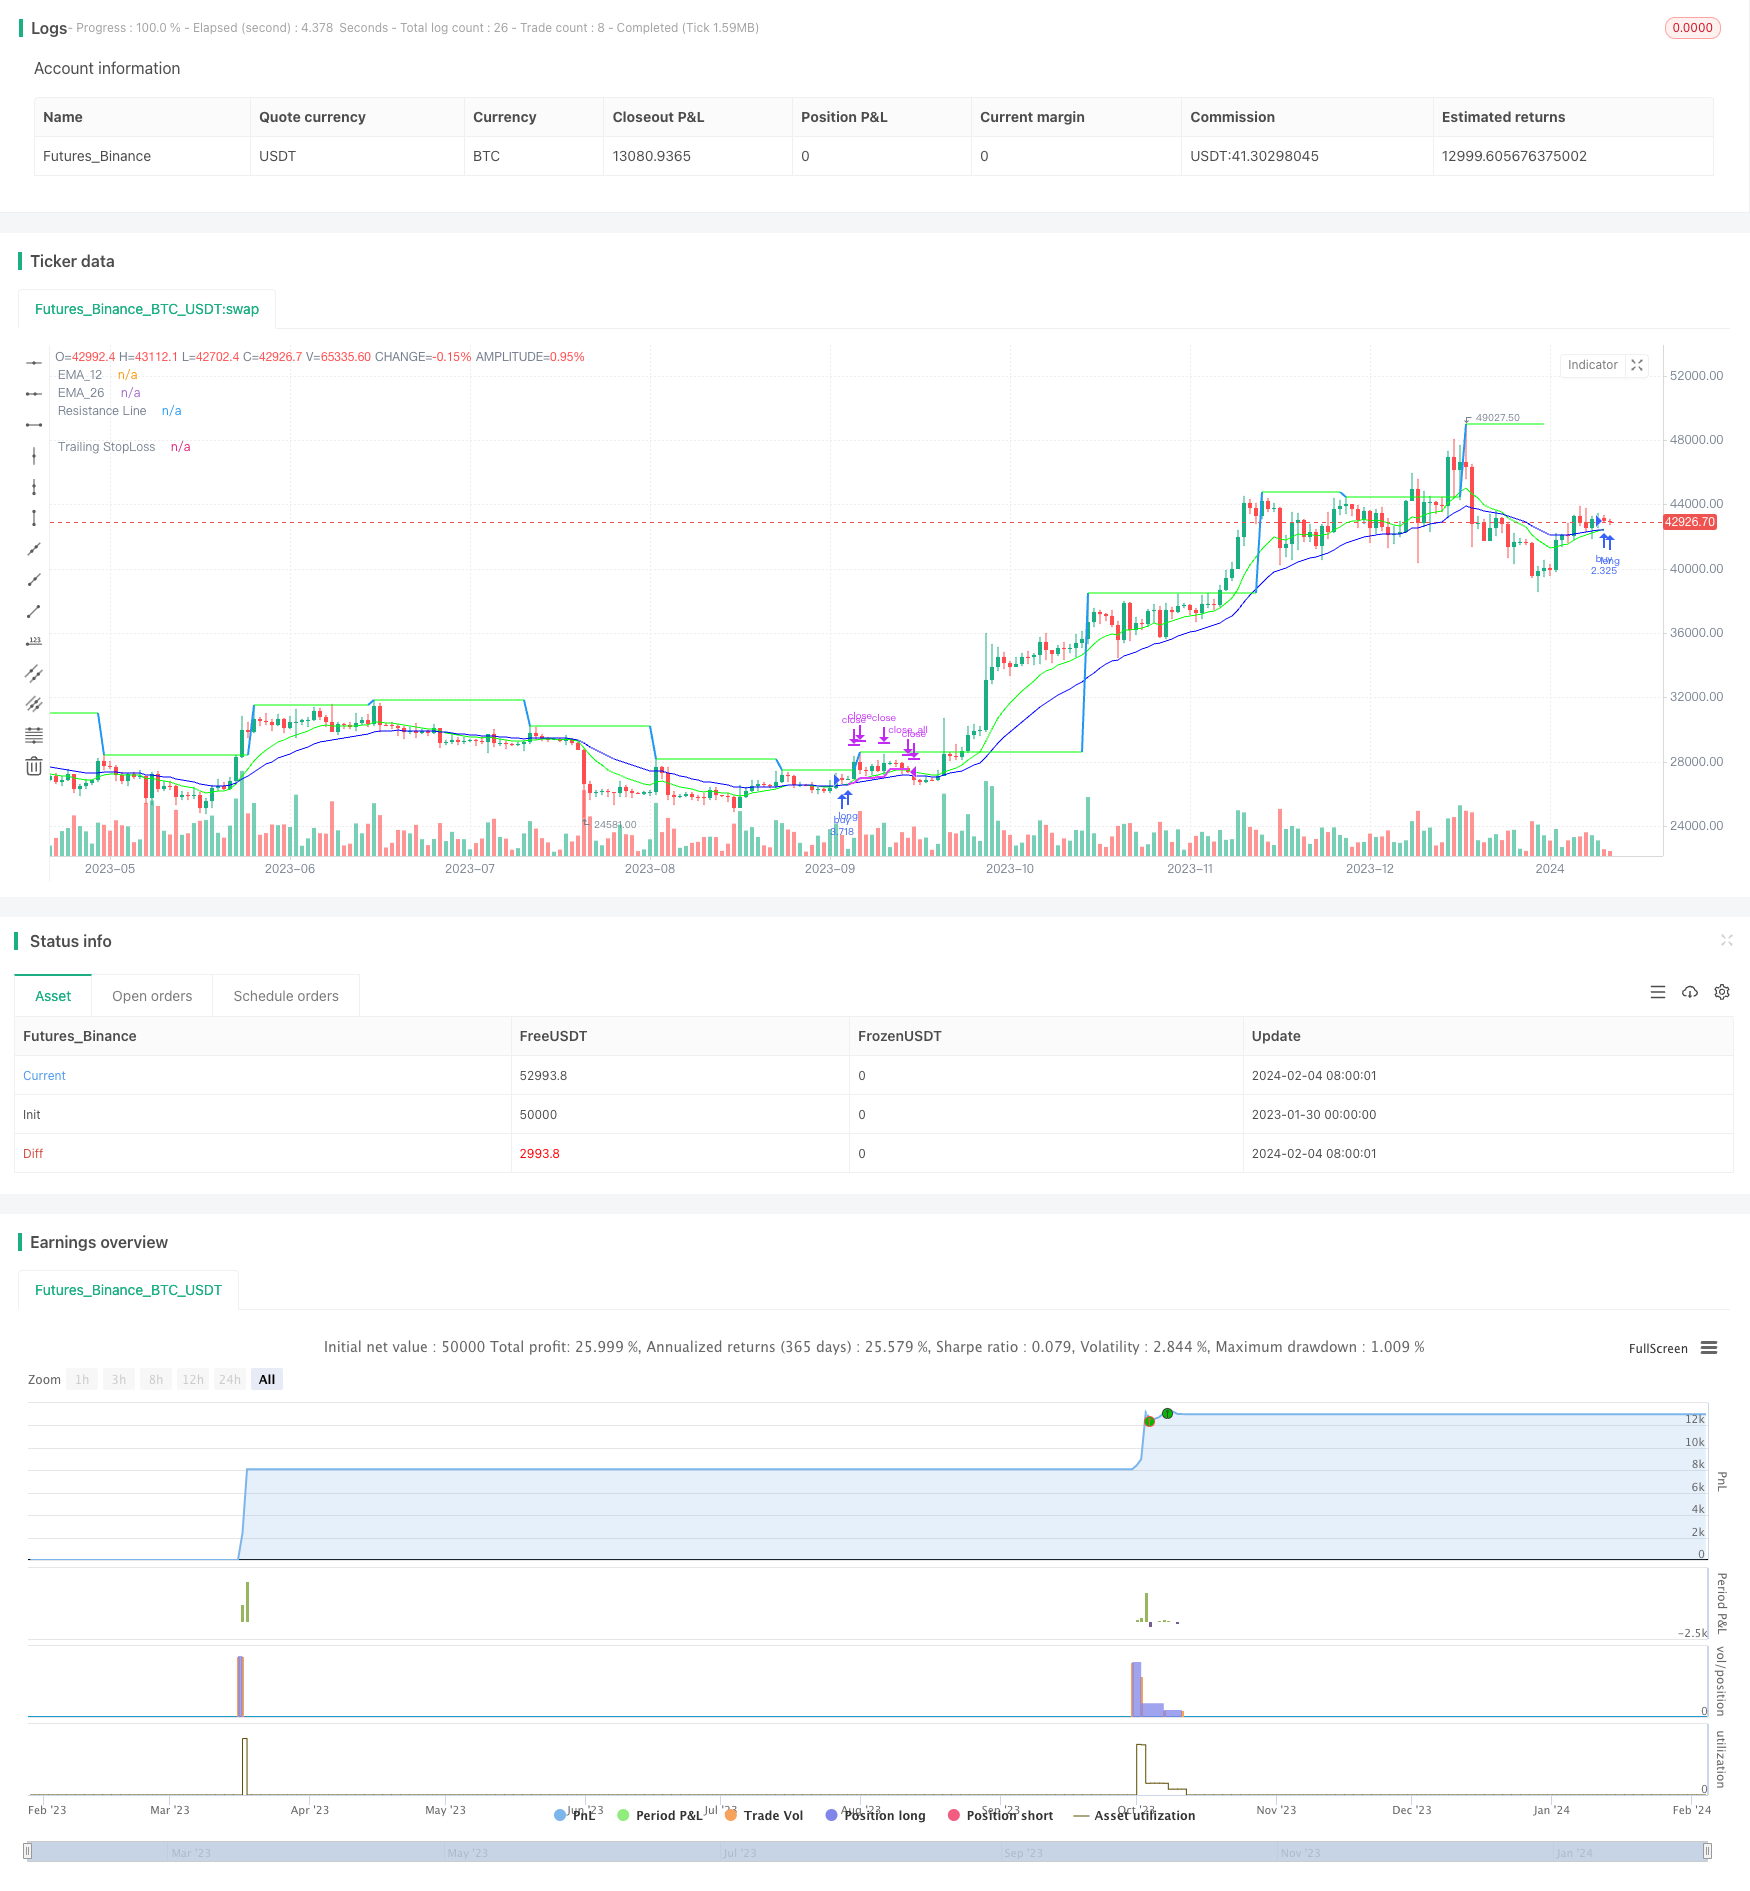
Chiến lược này dựa trên đường trung bình di chuyển của chỉ số 12 ngày (EMA) và đường EMA 26 ngày làm tín hiệu đầu vào. Để lọc các đợt phá vỡ giả mạo, chiến lược này cũng đưa ra chỉ số MACD để xác định xu hướng thị trường và chỉ số RSI để xác định liệu nó có nằm trong khu vực quá mua quá bán hay không.
Về dừng lỗ, chiến lược cung cấp ba lựa chọn: theo dõi dừng, dừng đồng tuyến và ngã đồng tuyến. Về dừng lỗ, chiến lược cung cấp hai mục tiêu dừng theo thứ tự.
Nguyên tắc chiến lược
Kích hiệu vào cửa
- Ngày 12 trên EMA vượt qua ngày 26 EMA tạo thành một cái nĩa vàng
- Chỉ số MACD là dương và đường MACD cao hơn đường Signal
- Chỉ số RSI nằm trong phạm vi được thiết lập
- Giá đóng cửa cao hơn EMA ngày 21 và SMA ngày 7
Chứng nhận nhập học
- Đánh giá tùy chọn: Giá vượt ngưỡng kháng cự động
Phương pháp dừng lỗ
- Tracking Stop Loss: Theo giá nhập và phần trăm Tracking Stop Loss thiết lập Tracking Stop Loss
- Đường dừng trung bình: Giá đóng cửa giảm xuống dưới mức dừng SMA ngày 7
- Đường trung bình: 12 ngày EMA, 26 ngày EMA.
Phương pháp ngăn chặn
- Thiết lập hai mục tiêu dừng theo thứ tự, bán một phần số lượng khi lệnh dừng đầu tiên được kích hoạt và bán toàn bộ số lượng khi lệnh dừng thứ hai được kích hoạt
Lợi thế chiến lược
- Sử dụng hệ thống lọc trung bình để lọc tín hiệu sai lệch, cải thiện độ chính xác vào sân
- Nhiều lựa chọn dừng lỗ phù hợp với các loại thương nhân khác nhau
- Động thái theo dõi dừng lỗ thực hiện kiểm soát rủi ro
- Mục tiêu của Stop Stop là xuất hiện hàng loạt và khóa một phần lợi nhuận.
Rủi ro chiến lược
- Các chỉ số EMA tạo ra nhiều tín hiệu sai khi thị trường biến động
- Tracking Stop Loss có thể bị phá vỡ sau khi vượt qua
- Mức dừng chân của Fork Dead Average không thể dừng lại kịp thời khi xu hướng đảo ngược
Phản ứng:
- Kết hợp các chỉ số MACD để đánh giá xu hướng thị trường thực tế
- Điều chỉnh mức độ dừng theo dõi
- Lựa chọn các phương thức khác hoặc kết hợp các phương thức dừng
Hướng tối ưu hóa chiến lược
- Tối ưu hóa các tham số EMA để xác định sự kết hợp tham số tốt nhất
- Kiểm tra các phương thức và tham số dừng khác nhau để tìm giải pháp dừng tốt nhất
- Kiểm tra các tham số khác nhau để tối ưu hóa hiệu quả
- Kết hợp với các chỉ số khác để đánh giá thời gian nhập cảnh
- Điều chỉnh theo các tham số khác nhau về giống và chu kỳ
Tóm tắt
Chiến lược này sử dụng hệ thống đường thẳng như tín hiệu giao dịch chính, hỗ trợ lọc vào bằng các chỉ số như MACD, RSI. Phương thức dừng lỗ và mục tiêu dừng lỗ đều được thiết lập tối ưu hóa, có thể điều chỉnh thông qua các tham số để phù hợp với các loại nhà đầu tư khác nhau.
/*backtest
start: 2023-01-30 00:00:00
end: 2024-02-05 00:00:00
period: 1d
basePeriod: 1h
exchanges: [{"eid":"Futures_Binance","currency":"BTC_USDT"}]
*/

// This source code is subject to the terms of the Mozilla Public License 2.0 at https://mozilla.org/MPL/2.0/
// © AbdulRahimShama
//@version=5


strategy('12/26-IT strategy', overlay=true,initial_capital = 100000)


Show_Only_12_26_Crossover_Entry = input.bool(true, group = "Entry_Exit Criteria")
Show_12_26_Crossover_and_resistance_Entry = input.bool(false, group = "Entry_Exit Criteria")


Show_TSL_StopLoss = input.bool(true, group = "Entry_Exit Criteria")
Show_Crossdown_StopLoss = input.bool(true, group = "Entry_Exit Criteria")
Show_SMA7_StopLoss = input.bool(false, group = "Entry_Exit Criteria")


////////////////////////////////////////////////
////////////////TARGETS INPUT
////////////////////////////////////////////////

////////Target1

TargetPerc1 = input.float(title="Target (%)", minval=0,defval=5, group="Target-1") / 100
TargetPrice1 = strategy.position_avg_price * (1 + TargetPerc1)
Target1_exit_qty = input.int(50, group="Target-1",tooltip = "% qty to sell when Target1 is reached")


////////Target2

TargetPerc2 = input.float(title="Target (%)", minval=0,defval=10, group="Target-2") / 100
TargetPrice2 = strategy.position_avg_price * (1 + TargetPerc2)
Target2_exit_qty = input.int(100, group="Target-2",tooltip = "% qty to sell when Target2 is reached")


////////////////////////////////////////////////
////////////////TRAILING STOP LOSS
////////////////////////////////////////////////


TSLsource = input(low, title="TSL Source", group="Trailing StopLoss")

longTrailPerc = input.float(title='Trail Long Loss (%)', minval=0.0, step=0.1, defval=1, group="Trailing StopLoss") * 0.01

TrailStopPrice = 0.0

TrailStopPrice := if strategy.position_size > 0
    sPIVOT_highValue = TSLsource * (1 - longTrailPerc)
    math.max(sPIVOT_highValue, TrailStopPrice[1])
else
    0

TSL = close < TrailStopPrice
plot(series=strategy.position_size > 0 and Show_TSL_StopLoss ? TrailStopPrice : na, color=color.new(color.fuchsia, 0), style=plot.style_linebr, linewidth=2, title='Trailing StopLoss')


////////////////////////////////////////////////
////////////////Moving Averages
////////////////////////////////////////////////


EMA_12=ta.ema(close, 12)
EMA_26=ta.ema(close, 26)
EMA_21=ta.ema(close,21)

plot(EMA_12, title="EMA_12", color=color.rgb(0, 255, 0), offset=0, linewidth=1)
plot(EMA_26, title="EMA_26", color=color.rgb(0, 0, 255), offset=0, linewidth=1)
plot(Show_SMA7_StopLoss ? ta.sma(close,7) : na, title="SMA_7", color=color.rgb(255, 0, 0), offset=0, linewidth=1)


////////////////////////////////////////////////
////////////////RESISTANCE INPUT and PLOTTING
////////////////////////////////////////////////

CrossOverLookbackCandles = input.int(10, group= "RESISTANCE")

resistanceSRC = input(high, group= "RESISTANCE")
resistanceLEFT = input(10, group= "RESISTANCE")
resistanceRIGHT = input(10, group= "RESISTANCE")

hih = ta.pivothigh(resistanceSRC, resistanceLEFT, resistanceRIGHT)
top = ta.valuewhen(hih, resistanceSRC[resistanceRIGHT], 0)

res = plot(top, color=top != top[1] ? na : color.new(#00ff00, 50), offset=-resistanceLEFT, linewidth=2, title="Resistance Line")

EMA_12_Low = ta.lowest(EMA_12, CrossOverLookbackCandles)
EMA_26_Low = ta.lowest(EMA_26, CrossOverLookbackCandles)


////////////////////////////////////////////////
////////////////RSI INPUT and PLOTTING
////////////////////////////////////////////////
RSI = ta.rsi(close, 14)
RSILowerRange = input.int(50, tooltip = "RSI value should be ABOVE this value for entry", group = "RSI")
RSIUpperRange = input.int(70, tooltip = "RSI value should be BELOW this value for entry", group = "RSI")


////////////////////////////////////////////////
////////////////MACD
////////////////////////////////////////////////
fast_length = 12
slow_length = 26
MACD_src = close
signal_length = 9

fast_ma = ta.ema(MACD_src, fast_length)
slow_ma = ta.ema(MACD_src, slow_length)
macd = fast_ma - slow_ma
signal = ta.ema(macd, signal_length)
hist = macd - signal


////////////////////////////////////////////////
////////////////ENTRY CRITERIA
////////////////////////////////////////////////


BUYVALUE= input(100000, tooltip = "Buy qty displayed on chart will be based on this value")

BASEENTRY = macd > signal and RSI > RSILowerRange and RSI < RSIUpperRange and close > EMA_21 and close > ta.sma(close, 7)


Entry= ta.crossover(EMA_12, EMA_26) and BASEENTRY
Entry2 = ta.crossover(close, top) and EMA_12_Low < EMA_26_Low and EMA_12 > EMA_26 and RSI < 70

////////////////////////////////////////////////
////////////////BUY SELL STRATEGY
////////////////////////////////////////////////

if ((Entry and Show_Only_12_26_Crossover_Entry))
    strategy.entry("buy", strategy.long, qty=BUYVALUE/close)

if (Entry2 and Show_12_26_Crossover_and_resistance_Entry)
    strategy.entry("buy", strategy.long, qty=BUYVALUE/close)

strategy.exit("Tg1", "buy", limit=TargetPrice1, qty_percent = Target1_exit_qty)
strategy.exit("Tg2", "buy", limit=TargetPrice2, qty_percent = Target2_exit_qty)


if TSL and Show_TSL_StopLoss and close < EMA_12
    strategy.close_all ("sl")

if ta.crossunder(EMA_12, EMA_26) and Show_Crossdown_StopLoss
    strategy.close_all ("sl")

if ta.crossunder(close, ta.sma(close, 7)) and Show_SMA7_StopLoss
    strategy.close_all ("sl")