Chiến lược phán đoán xu hướng động MACD dựa trên đường trung bình động

1
Follow
1782
Followers
Tổng quan
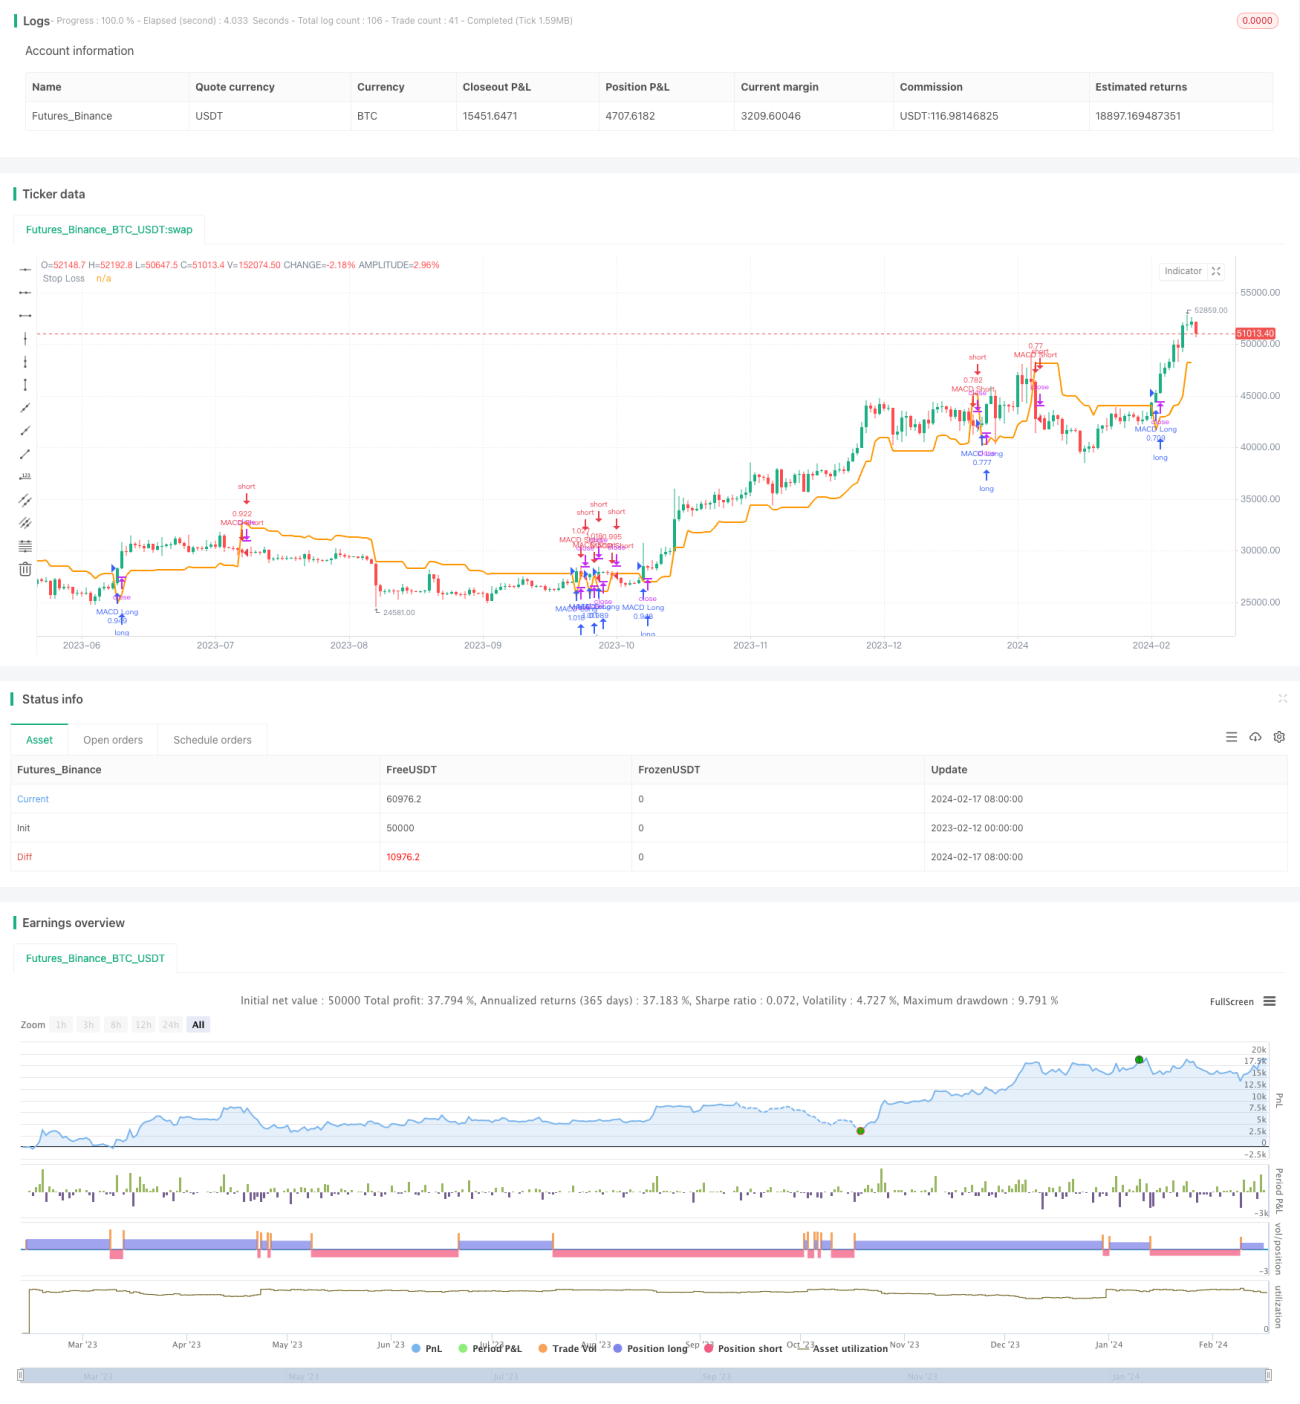
Chiến lược này dựa trên kết hợp đường trung bình của chỉ số MACD, để đánh giá xu hướng động trong chu kỳ thời gian, thuộc về chiến lược theo dõi xu hướng cổ điển. Chủ yếu thông qua sự khác biệt của đường trung bình nhanh và chậm MACD và mối quan hệ giữa đường tín hiệu của nó, để đánh giá hướng và sức mạnh của xu hướng hiện tại. Đồng thời giới thiệu phán đoán xuyên chu kỳ để tăng độ chính xác, động cơ điều chỉnh vị trí.
Nguyên tắc chiến lược
- Định hướng xu hướng hiện tại dựa trên sự chênh lệch đường trung bình nhanh của MACD và mối quan hệ đường tín hiệu của nó
- MACD khác biệt trên đường tín hiệu là tín hiệu đa, dưới là tín hiệu trống
- Tiến hành MACD chênh lệch và MACD cột đồng chiều tăng cường tín hiệu chiến lược
- Thêm mô-đun phán đoán xuyên chu kỳ, lấy chỉ số MACD chu kỳ thời gian cao hơn làm cơ sở điều chỉnh sóng và vị trí của tín hiệu
- Hoạt động điều chỉnh vị trí, giảm quy mô vị trí khi tín hiệu xuyên chu kỳ yếu, tăng vị trí khi tín hiệu tăng
Phân tích lợi thế
- Chỉ số MACD có hiệu quả cao hơn trong việc xác định xu hướng
- Sự khác biệt MACD kết hợp và xác thực kép đường cột, có thể cải thiện độ chính xác của tín hiệu
- Quá trình phán đoán xuyên chu kỳ giúp tăng sự ổn định của chiến lược, tránh bị sai lệch bởi tín hiệu tần số cao
- Động thái điều chỉnh vị thế giúp chiến lược nắm bắt cơ hội tốt hơn và tăng lợi nhuận dư thừa
Phân tích rủi ro và giải pháp
- Các tín hiệu MACD bị chậm và có thể gây ra hiệu quả tín hiệu kém
- Giải pháp: Tăng giá trị chênh lệch giữa đường trung bình nhanh và đường trung bình chậm để bắt tín hiệu sớm hơn
- Các tín hiệu xuyên chu kỳ không nhất thiết phải chính xác và có thể gây hiểu nhầm chiến lược
- Giải pháp: đưa ra cơ chế điều chỉnh vị trí động, để chiến lược chu kỳ chính chiếm ưu thế
- Chiến lược kết hợp nhiều yếu tố có thể không ổn định tổng thể
- Giải pháp: Điều chỉnh tỉ trọng các tham số của chiến lược để đảm bảo sự ổn định tổng thể
Hướng tối ưu hóa
- Kiểm tra hiệu quả của các kết hợp các tham số chu kỳ khác nhau
- Kiểm tra tác động của các kết hợp khác nhau trên các chiến lược
- Điều chỉnh các tham số chỉ số MACD, chẳng hạn như chu kỳ đường trung bình chậm, chu kỳ đường tín hiệu
- Kiểm tra hiệu quả của các yếu tố điều chỉnh vị trí khác nhau
- Thử nghiệm phản hồi trên các giống khác
Tóm tắt
Các MACD đường trung bình kết hợp các chiến lược xu hướng động xuyên chu kỳ, tích hợp các lợi thế của các chỉ số cổ điển phán đoán và nhiều khung thời gian tham khảo. Bằng cách tối ưu hóa tham số và thử nghiệm kết hợp, có thể xây dựng một chiến lược theo dõi xu hướng ổn định hơn, lợi nhuận tốt.
Source
Pine
Strategy parameters
Related strategies
Comment
All comments (0)
No data
- 1