
Chiến lược này chủ yếu dựa trên chỉ số SSL Channel và chỉ số xu hướng sóng, kết hợp với các chỉ số phụ trợ khác, để thực hiện một chiến lược giao dịch định lượng hoàn chỉnh hơn. Tên chiến lược bao gồm các chỉ số cốt lõi SSL Channel và xu hướng sóng, cũng như các từ khóa định lượng giao dịch, phù hợp với yêu cầu.
Chiến lược này dựa trên sáu điều kiện để tham gia giao dịch, hai điều kiện đầu tiên là điều kiện cốt lõi, cụ thể như sau:
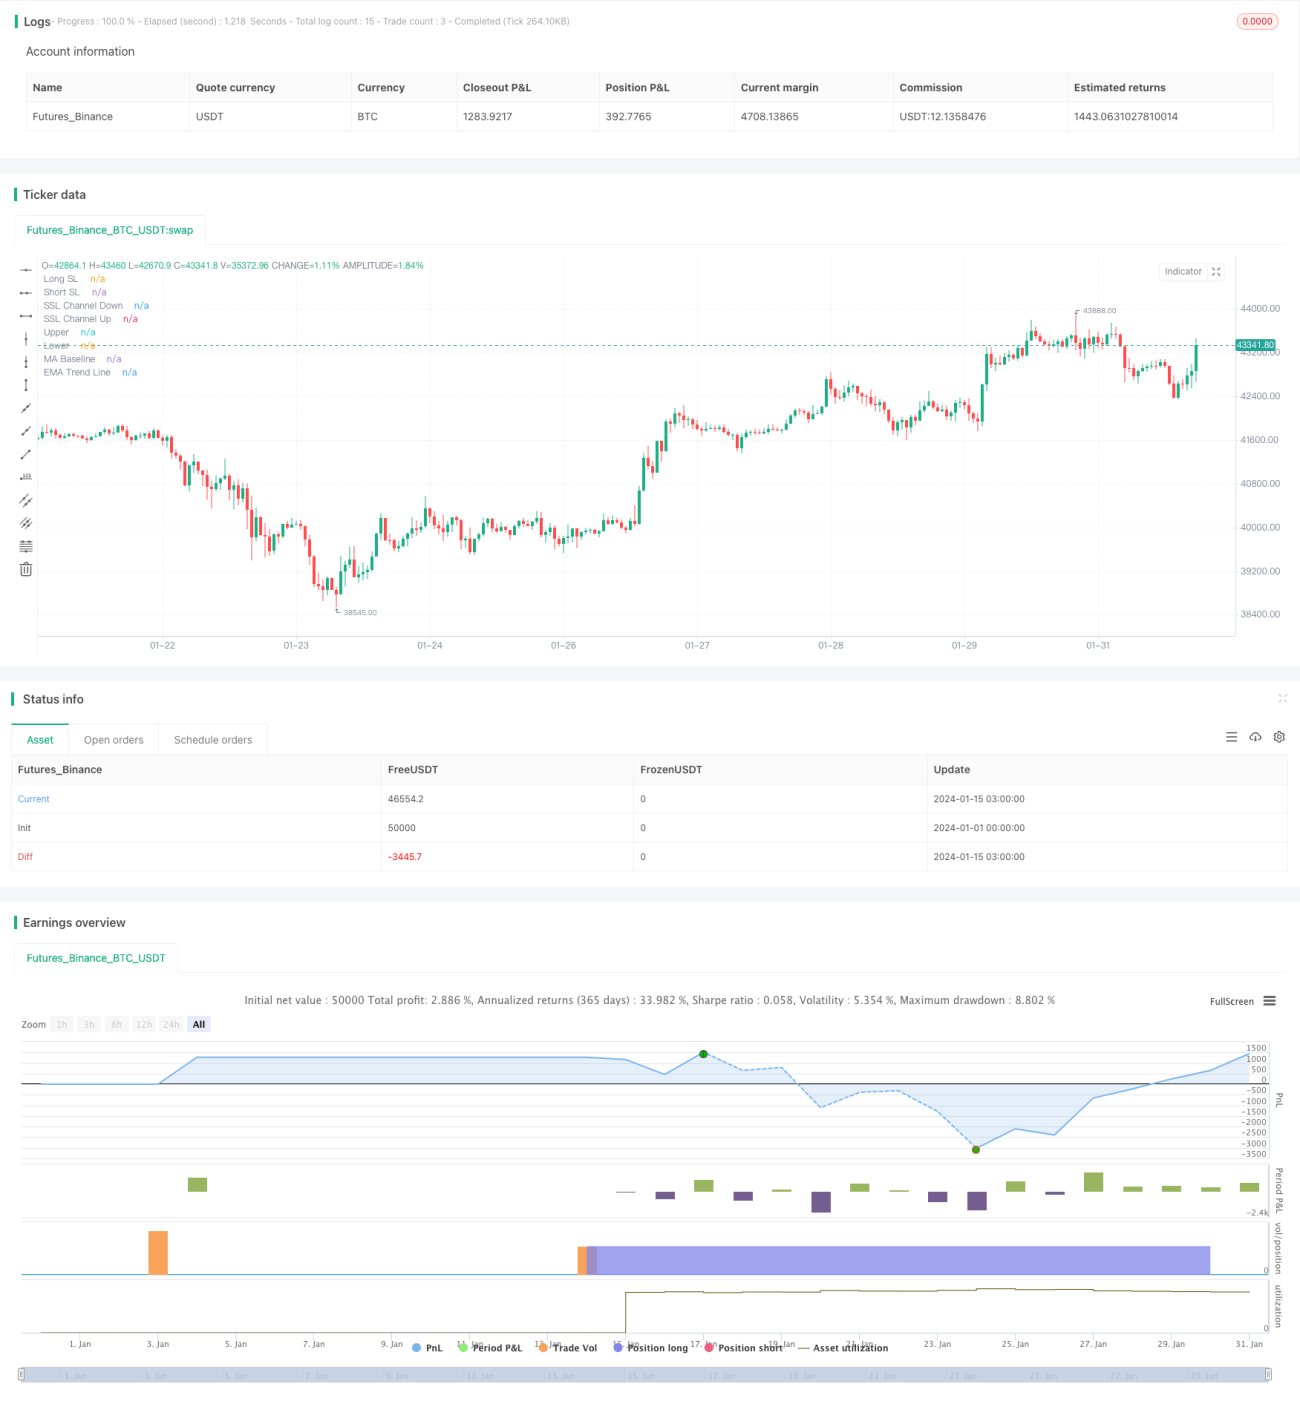
Khi 6 điều kiện này được đáp ứng cùng một lúc, chiến lược sẽ nhập thêm hoặc bỏ đi. Khoảng cách dừng lỗ được tính dựa trên số liệu của chỉ số ATR, và khoảng cách dừng là gấp đôi tỷ lệ phần thưởng rủi ro của dừng lỗ.
Chiến lược này cũng có cơ chế quản lý rủi ro hoàn hảo, bao gồm thiết lập dừng lỗ, kiểm soát quy mô vị trí và kiểm soát rút lui tối đa. Đồng thời, chiến lược này vẽ đường phụ trên biểu đồ, có thể nhìn thấy trực quan mỗi điểm dừng lỗ và điểm dừng lỗ, và tình huống thua lỗ cụ thể. Điều này rất hữu ích cho việc phân tích và tối ưu hóa chiến lược.
Lợi thế lớn nhất của chiến lược này là sử dụng chỉ số kênh SSL để xác định hướng xu hướng với độ chính xác rất cao, sau đó kết hợp với các chỉ số như xu hướng sóng để xác nhận, có thể làm giảm đáng kể tín hiệu giả. Đồng thời, các điều kiện nhập cảnh nghiêm ngặt cũng có thể tránh giao dịch không cần thiết, do đó giảm số lần giao dịch và giảm chi phí giao dịch.
Ngoài ra, cơ chế quản lý rủi ro và tiền của chiến lược này cũng là một lợi thế lớn. Các chiến lược dừng lỗ và ngăn chặn tốt được thiết lập trước có thể kiểm soát hiệu quả tổn thất tối đa của một giao dịch.
Rủi ro lớn nhất của chiến lược này là các điều kiện nhập cảnh nghiêm ngặt sẽ bỏ lỡ một số cơ hội giao dịch, gây ra một số ảnh hưởng đến lợi nhuận. Khi thị trường ở trong tình trạng biến động, lợi nhuận của chiến lược này cũng sẽ bị giảm giá.
Ngoài ra, các chỉ số đánh giá hiệu quả của xu hướng thị trường như xu hướng sóng cũng có thể bị ảnh hưởng bởi các trường hợp bất thường của thị trường như phá vỡ giả. Trong trường hợp này, cần điều chỉnh tham số hoặc thêm các chỉ số khác để xác nhận.
Nhìn chung, rủi ro của chiến lược này là có thể kiểm soát được. Bằng cách điều chỉnh và tối ưu hóa các tham số, chiến lược có thể thích ứng tốt hơn với các môi trường thị trường khác nhau.
Chiến lược này có thể được cải thiện theo một số cách:
Tối ưu hóa các tham số của xu hướng sóng để có thể đánh giá chính xác hơn các điểm biến xu hướng
Thêm các chỉ số khác để xác nhận, chẳng hạn như KDJ, MACD, v.v., để tránh ảnh hưởng của đột phá giả
Có thể điều chỉnh và tối ưu hóa các tham số cho các giống và chu kỳ khác nhau để tăng sự ổn định của chiến lược
Thêm thuật toán học máy, sử dụng đào tạo dữ liệu lịch sử, tham số chiến lược tối ưu hóa thời gian thực
Sử dụng các thuật toán như yếu tố tần số cao để tăng tần số giao dịch và lợi nhuận của chiến lược
Việc thực hiện các biện pháp tối ưu hóa này có thể giúp chiến lược này đạt được mức độ lợi nhuận và ổn định cao hơn.
Nhìn chung, chiến lược này tích hợp nhiều chỉ số và cơ chế nhập cảnh nghiêm ngặt, đồng thời đảm bảo tỷ lệ thắng cao và hiệu quả kiểm soát rủi ro tốt. Kết hợp với hướng tối ưu hóa trong tương lai, chiến lược này có tiềm năng phát triển lớn và là một chiến lược giao dịch định lượng đáng được đề xuất.
/*backtest
start: 2024-01-01 00:00:00
end: 2024-01-31 23:59:59
period: 1h
basePeriod: 15m
exchanges: [{"eid":"Futures_Binance","currency":"BTC_USDT"}]
*/
// This source code is subject to the terms of the Mozilla Public License 2.0 at https://mozilla.org/MPL/2.0/
// © kevinmck100
// @credits
// - Wave Trend: Indicator: WaveTrend Oscillator [WT] by @LazyBear
// - SSL Channel: SSL channel by @ErwinBeckers
// - SSL Hybrid: SSL Hybrid by @Mihkel00
// - Keltner Channels: Keltner Channels Bands by @ceyhun
// - Candle Height: Candle Height in Percentage - Columns by @FreeReveller
// - NNFX ATR: NNFX ATR by @sueun123
//
// Strategy: Based on the YouTube video "This Unique Strategy Made 47% Profit in 2.5 Months [SSL + Wave Trend Strategy Tested 100 Times]" by TradeSmart.
// @description
//
// Strategy incorporates the following features:
//
// - Risk management: Configurable X% loss per stop loss
// Configurable R:R ratio
//
// - Trade entry: Based on strategy conditions below
//
// - Trade exit: Based on strategy conditions below
//
// - Backtesting: Configurable backtesting range by date
//
// - Chart drawings: Each entry condition indicator can be turned on and off
// TP/SL boxes drawn for all trades. Can be turned on and off
// Trade exit information labels. Can be turned on and off
// NOTE: Trade drawings will only be applicable when using overlay strategies
//
// - Alerting: Alerts on LONG and SHORT trade entries
//
// - Debugging: Includes section with useful debugging techniques
//
// Strategy conditions:
//
// - Trade entry: LONG: C1: SSL Hybrid baseline is BLUE
// C2: SSL Channel crosses up (green on top)
// C3: Wave Trend crosses up (represented by pink candle body)
// C4: Entry candle height is not greater than configured threshold
// C5: Entry candle is inside Keltner Channel (wicks or body depending on configuration)
// C6: Take Profit target does not touch EMA (represents resistance)
//
// SHORT: C1: SSL Hybrid baseline is RED
// C2: SSL Channel crosses down (red on top)
// C3: Wave Trend crosses down (represented by orange candle body)
// C4: Entry candle height is not greater than configured threshold
// C5: Entry candle is inside Keltner Channel (wicks or body depending on configuration)
// C6: Take Profit target does not touch EMA (represents support)
//
// - Trade exit: Stop Loss: Size configurable with NNFX ATR multiplier
// Take Profit: Calculated from Stop Loss using R:R ratio
//@version=5
INITIAL_CAPITAL = 1000
DEFAULT_COMMISSION = 0.02
MAX_DRAWINGS = 500
IS_OVERLAY = true
strategy("SSL + Wave Trend Strategy", overlay = IS_OVERLAY, initial_capital = INITIAL_CAPITAL, currency = currency.NONE, max_labels_count = MAX_DRAWINGS, max_boxes_count = MAX_DRAWINGS, max_lines_count = MAX_DRAWINGS, default_qty_type = strategy.cash, commission_type = strategy.commission.percent, commission_value = DEFAULT_COMMISSION)
// =============================================================================
// INPUTS
// =============================================================================
// ----------------------
// Trade Entry Conditions
// ----------------------
useSslHybrid = input.bool (true, "Use SSL Hybrid Condition", group = "Strategy: Entry Conditions", inline = "SC1")
useKeltnerCh = input.bool (true, "Use Keltner Channel Condition ", group = "Strategy: Entry Conditions", inline = "SC2")
keltnerChWicks = input.bool (true, "Keltner Channel Include Wicks", group = "Strategy: Entry Conditions", inline = "SC2")
useEma = input.bool (true, "Target not touch EMA Condition", group = "Strategy: Entry Conditions", inline = "SC3")
useCandleHeight = input.bool (true, "Use Candle Height Condition", group = "Strategy: Entry Conditions", inline = "SC4")
candleHeight = input.float (1.0, "Candle Height Threshold ", group = "Strategy: Entry Conditions", inline = "SC5", minval = 0, step = 0.1, tooltip = "Percentage difference between high and low of a candle. Expressed as a decimal. Lowering this value will filter out trades on volatile candles.")
// ---------------------
// Trade Exit Conditions
// ---------------------
slAtrMultiplier = input.float (1.7, "Stop Loss ATR Multiplier ", group = "Strategy: Exit Conditions", inline = "EC1", minval = 0, step = 0.1, tooltip = "Size of StopLoss is determined by multiplication of ATR value. Take Profit is derived from this also by multiplying the StopLoss value by the Risk:Reward multiplier.")
// ---------------
// Risk Management
// ---------------
riskReward = input.float (2.5, "Risk : Reward 1 :", group = "Strategy: Risk Management", inline = "RM1", minval = 0, step = 0.1, tooltip = "Used to determine Take Profit level. Take Profit will be Stop Loss multiplied by this value.")
accountRiskPercent = input.float (1, "Portfolio Risk % ", group = "Strategy: Risk Management", inline = "RM2", minval = 0, step = 0.1, tooltip = "Percentage of portfolio you lose if trade hits SL.\n\nYou then stand to gain\n Portfolio Risk % * Risk : Reward\nif trade hits TP.")
// ----------
// Date Range
// ----------
startYear = input.int (2022, "Start Date ", group = "Strategy: Date Range", inline = "DR1", minval = 1900, maxval = 2100)
startMonth = input.int (1, "", group = "Strategy: Date Range", inline = "DR1", options = [1, 2, 3, 4, 5, 6, 7, 8, 9, 10, 11, 12])
startDate = input.int (1, "", group = "Strategy: Date Range", inline = "DR1", options = [1, 2, 3, 4, 5, 6, 7, 8, 9, 10, 11, 12, 13, 14, 15, 16, 17, 18, 19, 20, 21, 22, 23, 24, 25, 26, 27, 28, 29, 30, 31])
endYear = input.int (2100, "End Date ", group = "Strategy: Date Range", inline = "DR2", minval = 1900, maxval = 2100)
endMonth = input.int (1, "", group = "Strategy: Date Range", inline = "DR2", options = [1, 2, 3, 4, 5, 6, 7, 8, 9, 10, 11, 12])
endDate = input.int (1, "", group = "Strategy: Date Range", inline = "DR2", options = [1, 2, 3, 4, 5, 6, 7, 8, 9, 10, 11, 12, 13, 14, 15, 16, 17, 18, 19, 20, 21, 22, 23, 24, 25, 26, 27, 28, 29, 30, 31])
// ----------------
// Display Settings
// ----------------
showTpSlBoxes = input.bool (true, "Show TP / SL Boxes", group = "Strategy: Drawings", inline = "D1", tooltip = "Show or hide TP and SL position boxes.\n\nNote: TradingView limits the maximum number of boxes that can be displayed to 500 so they may not appear for all price data under test.")
showLabels = input.bool (false, "Show Trade Exit Labels", group = "Strategy: Drawings", inline = "D2", tooltip = "Useful labels to identify Profit/Loss and cumulative portfolio capital after each trade closes.\n\nAlso note that TradingView limits the max number of 'boxes' that can be displayed on a chart (max 500). This means when you lookback far enough on the chart you will not see the TP/SL boxes. However you can check this option to identify where trades exited.")
// ------------------
// Indicator Settings
// ------------------
// Indicator display options
showSslHybrid = input.bool (true, "Show SSL Hybrid", group = "Indicators: Drawings", inline = "ID1")
showSslChannel = input.bool (true, "Show SSL Channel", group = "Indicators: Drawings", inline = "ID2")
showEma = input.bool (true, "Show EMA", group = "Indicators: Drawings", inline = "ID3")
showKeltner = input.bool (true, "Show Keltner Channel", group = "Indicators: Drawings", inline = "ID4")
showWaveTrend = input.bool (true, "Show Wave Trend Flip Candles", group = "Indicators: Drawings", inline = "ID5")
showAtrSl = input.bool (true, "Show ATR Stop Loss Bands", group = "Indicators: Drawings", inline = "ID6")
// Wave Trend Settings
n1 = input.int (10, "Channel Length ", group = "Indicators: Wave Trend", inline = "WT1")
n2 = input.int (21, "Average Length ", group = "Indicators: Wave Trend", inline = "WT2")
obLevel1 = input.int (60, "Over Bought Level 1 ", group = "Indicators: Wave Trend", inline = "WT3")
obLevel2 = input.int (53, "Over Bought Level 2 ", group = "Indicators: Wave Trend", inline = "WT4")
osLevel1 = input.int (-60, "Over Sold Level 1 ", group = "Indicators: Wave Trend", inline = "WT5")
osLevel2 = input.int (-53, "Over Sold Level 2 ", group = "Indicators: Wave Trend", inline = "WT6")
// SSL Channel Settings
sslChLen = input.int (10, "Period ", group = "Indicators: SSL Channel", inline = "SC1")
// SSL Hybrid Settings
// Show/hide Inputs
show_color_bar = input.bool (false, "Show Color Bars", group = "Indicators: SSL Hybrid", inline = "SH2")
// Baseline Inputs
maType = input.string ("HMA", "Baseline Type ", group = "Indicators: SSL Hybrid", inline = "SH3", options=["SMA", "EMA", "DEMA", "TEMA", "LSMA", "WMA", "MF", "VAMA", "TMA", "HMA", "JMA", "Kijun v2", "EDSMA", "McGinley"])
len = input.int (60, "Baseline Length ", group = "Indicators: SSL Hybrid", inline = "SH4")
src = input.source (close, "Source ", group = "Indicators: SSL Hybrid", inline = "SH5")
kidiv = input.int (1, "Kijun MOD Divider ", group = "Indicators: SSL Hybrid", inline = "SH6", maxval=4)
jurik_phase = input.int (3, "* Jurik (JMA) Only - Phase ", group = "Indicators: SSL Hybrid", inline = "SH7")
jurik_power = input.int (1, "* Jurik (JMA) Only - Power ", group = "Indicators: SSL Hybrid", inline = "SH8")
volatility_lookback = input.int (10, "* Volatility Adjusted (VAMA) Only - Volatility lookback length", group = "Indicators: SSL Hybrid", inline = "SH9")
//Modular Filter Inputs
beta = input.float (0.8, "Modular Filter, General Filter Only - Beta ", group = "Indicators: SSL Hybrid", inline = "SH10", minval=0, maxval=1, step=0.1)
feedback = input.bool (false, "Modular Filter Only - Feedback", group = "Indicators: SSL Hybrid", inline = "SH11")
z = input.float (0.5, "Modular Filter Only - Feedback Weighting ", group = "Indicators: SSL Hybrid", inline = "SH12", step=0.1, minval=0, maxval=1)
//EDSMA Inputs
ssfLength = input.int (20, "EDSMA - Super Smoother Filter Length ", group = "Indicators: SSL Hybrid", inline = "SH13", minval=1)
ssfPoles = input.int (2, "EDSMA - Super Smoother Filter Poles ", group = "Indicators: SSL Hybrid", inline = "SH14", options=[2, 3])
///Keltner Baseline Channel Inputs
useTrueRange = input.bool (true, "Use True Range?", group = "Indicators: SSL Hybrid", inline = "SH15")
multy = input.float (0.2, "Base Channel Multiplier ", group = "Indicators: SSL Hybrid", inline = "SH16", step=0.05)
// EMA Settings
emaLength = input.int (200, "EMA Length ", group = "Indicators: EMA", inline = "E1", minval = 1)
// Keltner Channel Settings
kcLength = input.int (20, "Length ", group = "Indicators: Keltner Channel", inline = "KC1", minval=1)
kcMult = input.float (1.5, "Multiplier ", group = "Indicators: Keltner Channel", inline = "KC2")
kcSrc = input.source (close, "Source ", group = "Indicators: Keltner Channel", inline = "KC3")
alen = input.int (10, "ATR Length ", group = "Indicators: Keltner Channel", inline = "KC4", minval=1)
// Candle Height in Percentage Settings
chPeriod = input.int (20, "Period ", group = "Indicators: Candle Height", inline = "CH1")
// NNFX ATR Settings
nnfxAtrLength = input.int (14, "Length ", group = "Indicators: NNFX ATR (Stop Loss Settings)", inline = "ATR1", minval = 1)
nnfxSmoothing = input.string ("RMA", "Smoothing ", group = "Indicators: NNFX ATR (Stop Loss Settings)", inline = "ATR3", options = ["RMA", "SMA", "EMA", "WMA"])
// =============================================================================
// INDICATORS
// =============================================================================
// ----------
// Wave Trend
// ----------
ap = hlc3
esa = ta.ema(ap, n1)
d = ta.ema(math.abs(ap - esa), n1)
ci = (ap - esa) / (0.015 * d)
tci = ta.ema(ci, n2)
wt1 = tci
wt2 = ta.sma(wt1, 4)
// Show Wave Trend crosses on chart as colour changes (pink bullish, orange bearish)
wtBreakUp = ta.crossover (wt1, wt2)
wtBreakDown = ta.crossunder (wt1, wt2)
barColour = showWaveTrend ? wtBreakUp ? color.fuchsia : wtBreakDown ? color.orange : na : na
barcolor(color = barColour)
// -----------
// SSL Channel
// -----------
smaHigh = ta.sma(high, sslChLen)
smaLow = ta.sma(low, sslChLen)
var int sslChHlv = na
sslChHlv := close > smaHigh ? 1 : close < smaLow ? -1 : sslChHlv[1]
sslChDown = sslChHlv < 0 ? smaHigh : smaLow
sslChUp = sslChHlv < 0 ? smaLow : smaHigh
plot(showSslChannel ? sslChDown : na, "SSL Channel Down", linewidth=1, color=color.new(color.red, 30))
plot(showSslChannel ? sslChUp : na, "SSL Channel Up", linewidth=1, color=color.new(color.lime, 30))
// ----------
// SSL Hybrid
// ----------
//EDSMA
get2PoleSSF(src, length) =>
PI = 2 * math.asin(1)
arg = math.sqrt(2) * PI / length
a1 = math.exp(-arg)
b1 = 2 * a1 * math.cos(arg)
c2 = b1
c3 = -math.pow(a1, 2)
c1 = 1 - c2 - c3
ssf = 0.0
ssf:= c1 * src + c2 * nz(ssf[1]) + c3 * nz(ssf[2])
ssf
get3PoleSSF(src, length) =>
PI = 2 * math.asin(1)
arg = PI / length
a1 = math.exp(-arg)
b1 = 2 * a1 * math.cos(1.738 * arg)
c1 = math.pow(a1, 2)
coef2 = b1 + c1
coef3 = -(c1 + b1 * c1)
coef4 = math.pow(c1, 2)
coef1 = 1 - coef2 - coef3 - coef4
ssf = 0.0
ssf := coef1 * src + coef2 * nz(ssf[1]) + coef3 * nz(ssf[2]) + coef4 * nz(ssf[3])
ssf
ma(type, src, len) =>
float result = 0
if type == "TMA"
result := ta.sma(ta.sma(src, math.ceil(len / 2)), math.floor(len / 2) + 1)
result
if type == "MF"
ts = 0.
b = 0.
c = 0.
os = 0.
//----
alpha = 2 / (len + 1)
a = feedback ? z * src + (1 - z) * nz(ts[1], src) : src
//----
b := a > alpha * a + (1 - alpha) * nz(b[1], a) ? a : alpha * a + (1 - alpha) * nz(b[1], a)
c := a < alpha * a + (1 - alpha) * nz(c[1], a) ? a : alpha * a + (1 - alpha) * nz(c[1], a)
os := a == b ? 1 : a == c ? 0 : os[1]
//----
upper = beta * b + (1 - beta) * c
lower = beta * c + (1 - beta) * b
ts := os * upper + (1 - os) * lower
result := ts
result
if type == "LSMA"
result := ta.linreg(src, len, 0)
result
if type == "SMA" // Simple
result := ta.sma(src, len)
result
if type == "EMA" // Exponential
result := ta.ema(src, len)
result
if type == "DEMA" // Double Exponential
e = ta.ema(src, len)
result := 2 * e - ta.ema(e, len)
result
if type == "TEMA" // Triple Exponential
e = ta.ema(src, len)
result := 3 * (e - ta.ema(e, len)) + ta.ema(ta.ema(e, len), len)
result
if type == "WMA" // Weighted
result := ta.wma(src, len)
result
if type == "VAMA" // Volatility Adjusted
/// Copyright © 2019 to present, Joris Duyck (JD)
mid = ta.ema(src, len)
dev = src - mid
vol_up = ta.highest(dev, volatility_lookback)
vol_down= ta.lowest(dev, volatility_lookback)
result := mid + math.avg(vol_up, vol_down)
result
if type == "HMA" // Hull
result := ta.wma(2 * ta.wma(src, len / 2) - ta.wma(src, len), math.round(math.sqrt(len)))
result
if type == "JMA" // Jurik
/// Copyright © 2018 Alex Orekhov (everget)
/// Copyright © 2017 Jurik Research and Consulting.
phaseRatio = jurik_phase < -100 ? 0.5 : jurik_phase > 100 ? 2.5 : jurik_phase / 100 + 1.5
beta = 0.45 * (len - 1) / (0.45 * (len - 1) + 2)
alpha = math.pow(beta, jurik_power)
jma = 0.0
e0 = 0.0
e0 := (1 - alpha) * src + alpha * nz(e0[1])
e1 = 0.0
e1 := (src - e0) * (1 - beta) + beta * nz(e1[1])
e2 = 0.0
e2 := (e0 + phaseRatio * e1 - nz(jma[1])) * math.pow(1 - alpha, 2) + math.pow(alpha, 2) * nz(e2[1])
jma := e2 + nz(jma[1])
result := jma
result
if type == "Kijun v2"
kijun = math.avg(ta.lowest(len), ta.highest(len)) //, (open + close)/2)
conversionLine = math.avg(ta.lowest(len / kidiv), ta.highest(len / kidiv))
delta = (kijun + conversionLine) / 2
result := delta
result
if type == "McGinley"
mg = 0.0
mg := na(mg[1]) ? ta.ema(src, len) : mg[1] + (src - mg[1]) / (len * math.pow(src / mg[1], 4))
result := mg
result
if type == "EDSMA"
zeros = src - nz(src[2])
avgZeros = (zeros + zeros[1]) / 2
// Ehlers Super Smoother Filter
ssf = ssfPoles == 2 ? get2PoleSSF(avgZeros, ssfLength) : get3PoleSSF(avgZeros, ssfLength)
// Rescale filter in terms of Standard Deviations
stdev = ta.stdev(ssf, len)
scaledFilter= stdev != 0 ? ssf / stdev : 0
alpha = 5 * math.abs(scaledFilter) / len
edsma = 0.0
edsma := alpha * src + (1 - alpha) * nz(edsma[1])
result := edsma
result
result
///Keltner Baseline Channel
BBMC = ma(maType, close, len)
Keltma = ma(maType, src, len)
range_1 = useTrueRange ? ta.tr : high - low
rangema = ta.ema(range_1, len)
upperk = Keltma + rangema * multy
lowerk = Keltma - rangema * multy
//COLORS
color_bar = close > upperk ? #00c3ff : close < lowerk ? #ff0062 : color.gray
//PLOTS
p1 = plot(showSslHybrid ? BBMC : na, color=color.new(color_bar, 0), linewidth=4, title="MA Baseline")
barcolor(show_color_bar ? color_bar : na)
// ---
// EMA
// ---
ema = ta.ema(close, emaLength)
plot(showEma ? ema : na, "EMA Trend Line", color.white)
// ----------------
// Keltner Channels
// ----------------
kcMa = ta.ema(kcSrc, kcLength)
KTop2 = kcMa + kcMult * ta.atr(alen)
KBot2 = kcMa - kcMult * ta.atr(alen)
upperPlot = plot(showKeltner ? KTop2 : na, color=color.new(color.blue, 0), title="Upper", style = plot.style_stepline)
lowerPlot = plot(showKeltner ? KBot2 : na, color=color.new(color.blue, 0), title="Lower", style = plot.style_stepline)
// ---------------------------
// Candle Height in Percentage
// ---------------------------
percentHL = (high - low) / low * 100
percentRed = open > close ? (open - close) / close * 100 : 0
percentGreen= open < close ? (close - open) / open * 100 : 0
// --------
// NNFX ATR
// --------
function(source, length) =>
if nnfxSmoothing == "RMA"
ta.rma(source, nnfxAtrLength)
else
if nnfxSmoothing == "SMA"
ta.sma(source, nnfxAtrLength)
else
if nnfxSmoothing == "EMA"
ta.ema(source, nnfxAtrLength)
else
ta.wma(source, nnfxAtrLength)
formula(number, decimals) =>
factor = math.pow(10, decimals)
int(number * factor) / factor
nnfxAtr = formula(function(ta.tr(true), nnfxAtrLength), 5) * slAtrMultiplier
//Sell
longSlAtr = nnfxAtrLength ? close - nnfxAtr : close + nnfxAtr
shortSlAtr = nnfxAtrLength ? close + nnfxAtr : close - nnfxAtr
plot(showAtrSl ? longSlAtr : na, "Long SL", color = color.new(color.red, 35), linewidth = 1, trackprice = true, editable = true, style = plot.style_stepline)
plot(showAtrSl ? shortSlAtr : na, "Short SL", color = color.new(color.red, 35), linewidth = 1, trackprice = true, editable = true, style = plot.style_stepline)
// =============================================================================
// FUNCTIONS
// =============================================================================
percentAsPoints(pcnt) =>
math.round(pcnt / 100 * close / syminfo.mintick)
calcStopLossPrice(pointsOffset, isLong) =>
priceOffset = pointsOffset * syminfo.mintick
if isLong
close - priceOffset
else
close + priceOffset
calcProfitTrgtPrice(pointsOffset, isLong) =>
calcStopLossPrice(-pointsOffset, isLong)
printLabel(barIndex, msg) => label.new(barIndex, close, msg)
printTpSlHitBox(left, right, slHit, tpHit, entryPrice, slPrice, tpPrice) =>
if showTpSlBoxes
box.new (left = left, top = entryPrice, right = right, bottom = slPrice, bgcolor = slHit ? color.new(color.red, 60) : color.new(color.gray, 90), border_width = 0)
box.new (left = left, top = entryPrice, right = right, bottom = tpPrice, bgcolor = tpHit ? color.new(color.green, 60) : color.new(color.gray, 90), border_width = 0)
line.new(x1 = left, y1 = entryPrice, x2 = right, y2 = entryPrice, color = color.new(color.yellow, 20))
line.new(x1 = left, y1 = slPrice, x2 = right, y2 = slPrice, color = color.new(color.red, 20))
line.new(x1 = left, y1 = tpPrice, x2 = right, y2 = tpPrice, color = color.new(color.green, 20))
printTpSlNotHitBox(left, right, entryPrice, slPrice, tpPrice) =>
if showTpSlBoxes
box.new (left = left, top = entryPrice, right = right, bottom = slPrice, bgcolor = color.new(color.gray, 90), border_width = 0)
box.new (left = left, top = entryPrice, right = right, bottom = tpPrice, bgcolor = color.new(color.gray, 90), border_width = 0)
line.new(x1 = left, y1 = entryPrice, x2 = right, y2 = entryPrice, color = color.new(color.yellow, 20))
line.new(x1 = left, y1 = slPrice, x2 = right, y2 = slPrice, color = color.new(color.red, 20))
line.new(x1 = left, y1 = tpPrice, x2 = right, y2 = tpPrice, color = color.new(color.green, 20))
printTradeExitLabel(x, y, posSize, entryPrice, pnl) =>
if showLabels
labelStr = "Position Size: " + str.tostring(math.abs(posSize), "#.##") + "\nPNL: " + str.tostring(pnl, "#.##") + "\nCapital: " + str.tostring(strategy.equity, "#.##") + "\nEntry Price: " + str.tostring(entryPrice, "#.##")
label.new(x = x, y = y, text = labelStr, color = pnl > 0 ? color.new(color.green, 60) : color.new(color.red, 60), textcolor = color.white, style = label.style_label_down)
// =============================================================================
// STRATEGY LOGIC
// =============================================================================
// See strategy description at top for details on trade entry/exit logis
// ----------
// CONDITIONS
// ----------
// Trade entry and exit variables
var tradeEntryBar = bar_index
var profitPoints = 0.
var lossPoints = 0.
var slPrice = 0.
var tpPrice = 0.
var inLong = false
var inShort = false
// Exit calculations
slAmount = nnfxAtr
slPercent = math.abs((1 - (close - slAmount) / close) * 100)
tpPercent = slPercent * riskReward
tpPoints = percentAsPoints(tpPercent)
tpTarget = calcProfitTrgtPrice(tpPoints, wtBreakUp)
inDateRange = true
// Condition 1: SSL Hybrid blue for long or red for short
bullSslHybrid = useSslHybrid ? close > upperk : true
bearSslHybrid = useSslHybrid ? close < lowerk : true
// Condition 2: SSL Channel crosses up for long or down for short
bullSslChannel = ta.crossover(sslChUp, sslChDown)
bearSslChannel = ta.crossover(sslChDown, sslChUp)
// Condition 3: Wave Trend crosses up for long or down for short
bullWaveTrend = wtBreakUp
bearWaveTrend = wtBreakDown
// Condition 4: Entry candle heignt <= 0.6 on Candle Height in Percentage
candleHeightValid = useCandleHeight ? percentGreen <= candleHeight and percentRed <= candleHeight : true
// Condition 5: Entry candle is inside Keltner Channel
withinCh = keltnerChWicks ? high < KTop2 and low > KBot2 : open < KTop2 and close < KTop2 and open > KBot2 and close > KBot2
insideKeltnerCh = useKeltnerCh ? withinCh : true
// Condition 6: TP target does not touch 200 EMA
bullTpValid = useEma ? not (close < ema and tpTarget > ema) : true
bearTpValid = useEma ? not (close > ema and tpTarget < ema) : true
// Combine all entry conditions
goLong = inDateRange and bullSslHybrid and bullSslChannel and bullWaveTrend and candleHeightValid and insideKeltnerCh and bullTpValid
goShort = inDateRange and bearSslHybrid and bearSslChannel and bearWaveTrend and candleHeightValid and insideKeltnerCh and bearTpValid
// Entry decisions
openLong = (goLong and not inLong)
openShort = (goShort and not inShort)
flippingSides = (goLong and inShort) or (goShort and inLong)
enteringTrade = openLong or openShort
inTrade = inLong or inShort
// Risk calculations
riskAmt = strategy.equity * accountRiskPercent / 100
entryQty = math.abs(riskAmt / slPercent * 100) / close
if openLong
if strategy.position_size < 0
printTpSlNotHitBox(tradeEntryBar + 1, bar_index + 1, strategy.position_avg_price, slPrice, tpPrice)
printTradeExitLabel(bar_index + 1, math.max(tpPrice, slPrice), strategy.position_size, strategy.position_avg_price, strategy.openprofit)
strategy.entry("Long", strategy.long, qty = entryQty, alert_message = "Long Entry")
enteringTrade := true
inLong := true
inShort := false
alert(message="BUY Trade Entry Alert", freq=alert.freq_once_per_bar_close)
if openShort
if strategy.position_size > 0
printTpSlNotHitBox(tradeEntryBar + 1, bar_index + 1, strategy.position_avg_price, slPrice, tpPrice)
printTradeExitLabel(bar_index + 1, math.max(tpPrice, slPrice), strategy.position_size, strategy.position_avg_price, strategy.openprofit)
strategy.entry("Short", strategy.short, qty = entryQty, alert_message = "Short Entry")
enteringTrade := true
inShort := true
inLong := false
alert(message="SELL Trade Entry Alert", freq=alert.freq_once_per_bar_close)
if enteringTrade
profitPoints := percentAsPoints(tpPercent)
lossPoints := percentAsPoints(slPercent)
slPrice := calcStopLossPrice(lossPoints, openLong)
tpPrice := calcProfitTrgtPrice(profitPoints, openLong)
tradeEntryBar := bar_index
strategy.exit("TP/SL", profit = profitPoints, loss = lossPoints, comment_profit = "TP Hit", comment_loss = "SL Hit", alert_profit = "TP Hit Alert", alert_loss = "SL Hit Alert")
// =============================================================================
// DRAWINGS
// =============================================================================
// -----------
// TP/SL Boxes
// -----------
slHit = (inShort and high >= slPrice) or (inLong and low <= slPrice)
tpHit = (inLong and high >= tpPrice) or (inShort and low <= tpPrice)
exitTriggered = slHit or tpHit
entryPrice = strategy.closedtrades.entry_price (strategy.closedtrades - 1)
pnl = strategy.closedtrades.profit (strategy.closedtrades - 1)
posSize = strategy.closedtrades.size (strategy.closedtrades - 1)
// Print boxes for trades closed at profit or loss
if (inTrade and exitTriggered)
inShort := false
inLong := false
// printTpSlHitBox(tradeEntryBar + 1, bar_index, slHit, tpHit, entryPrice, slPrice, tpPrice)
// printTradeExitLabel(bar_index, math.max(tpPrice, slPrice), posSize, entryPrice, pnl)
// Print TP/SL box for current open trade
if barstate.islastconfirmedhistory and strategy.position_size != 0
printTpSlNotHitBox(tradeEntryBar + 1, bar_index + 1, strategy.position_avg_price, slPrice, tpPrice)
// =============================================================================
// DEBUGGING
// =============================================================================
// Data window plots
plotchar(goLong, "Enter Long", "")
plotchar(goShort, "Enter Short", "")