Chiến lược tham khảo cho xu hướng tăng đột phá
Tổng quan
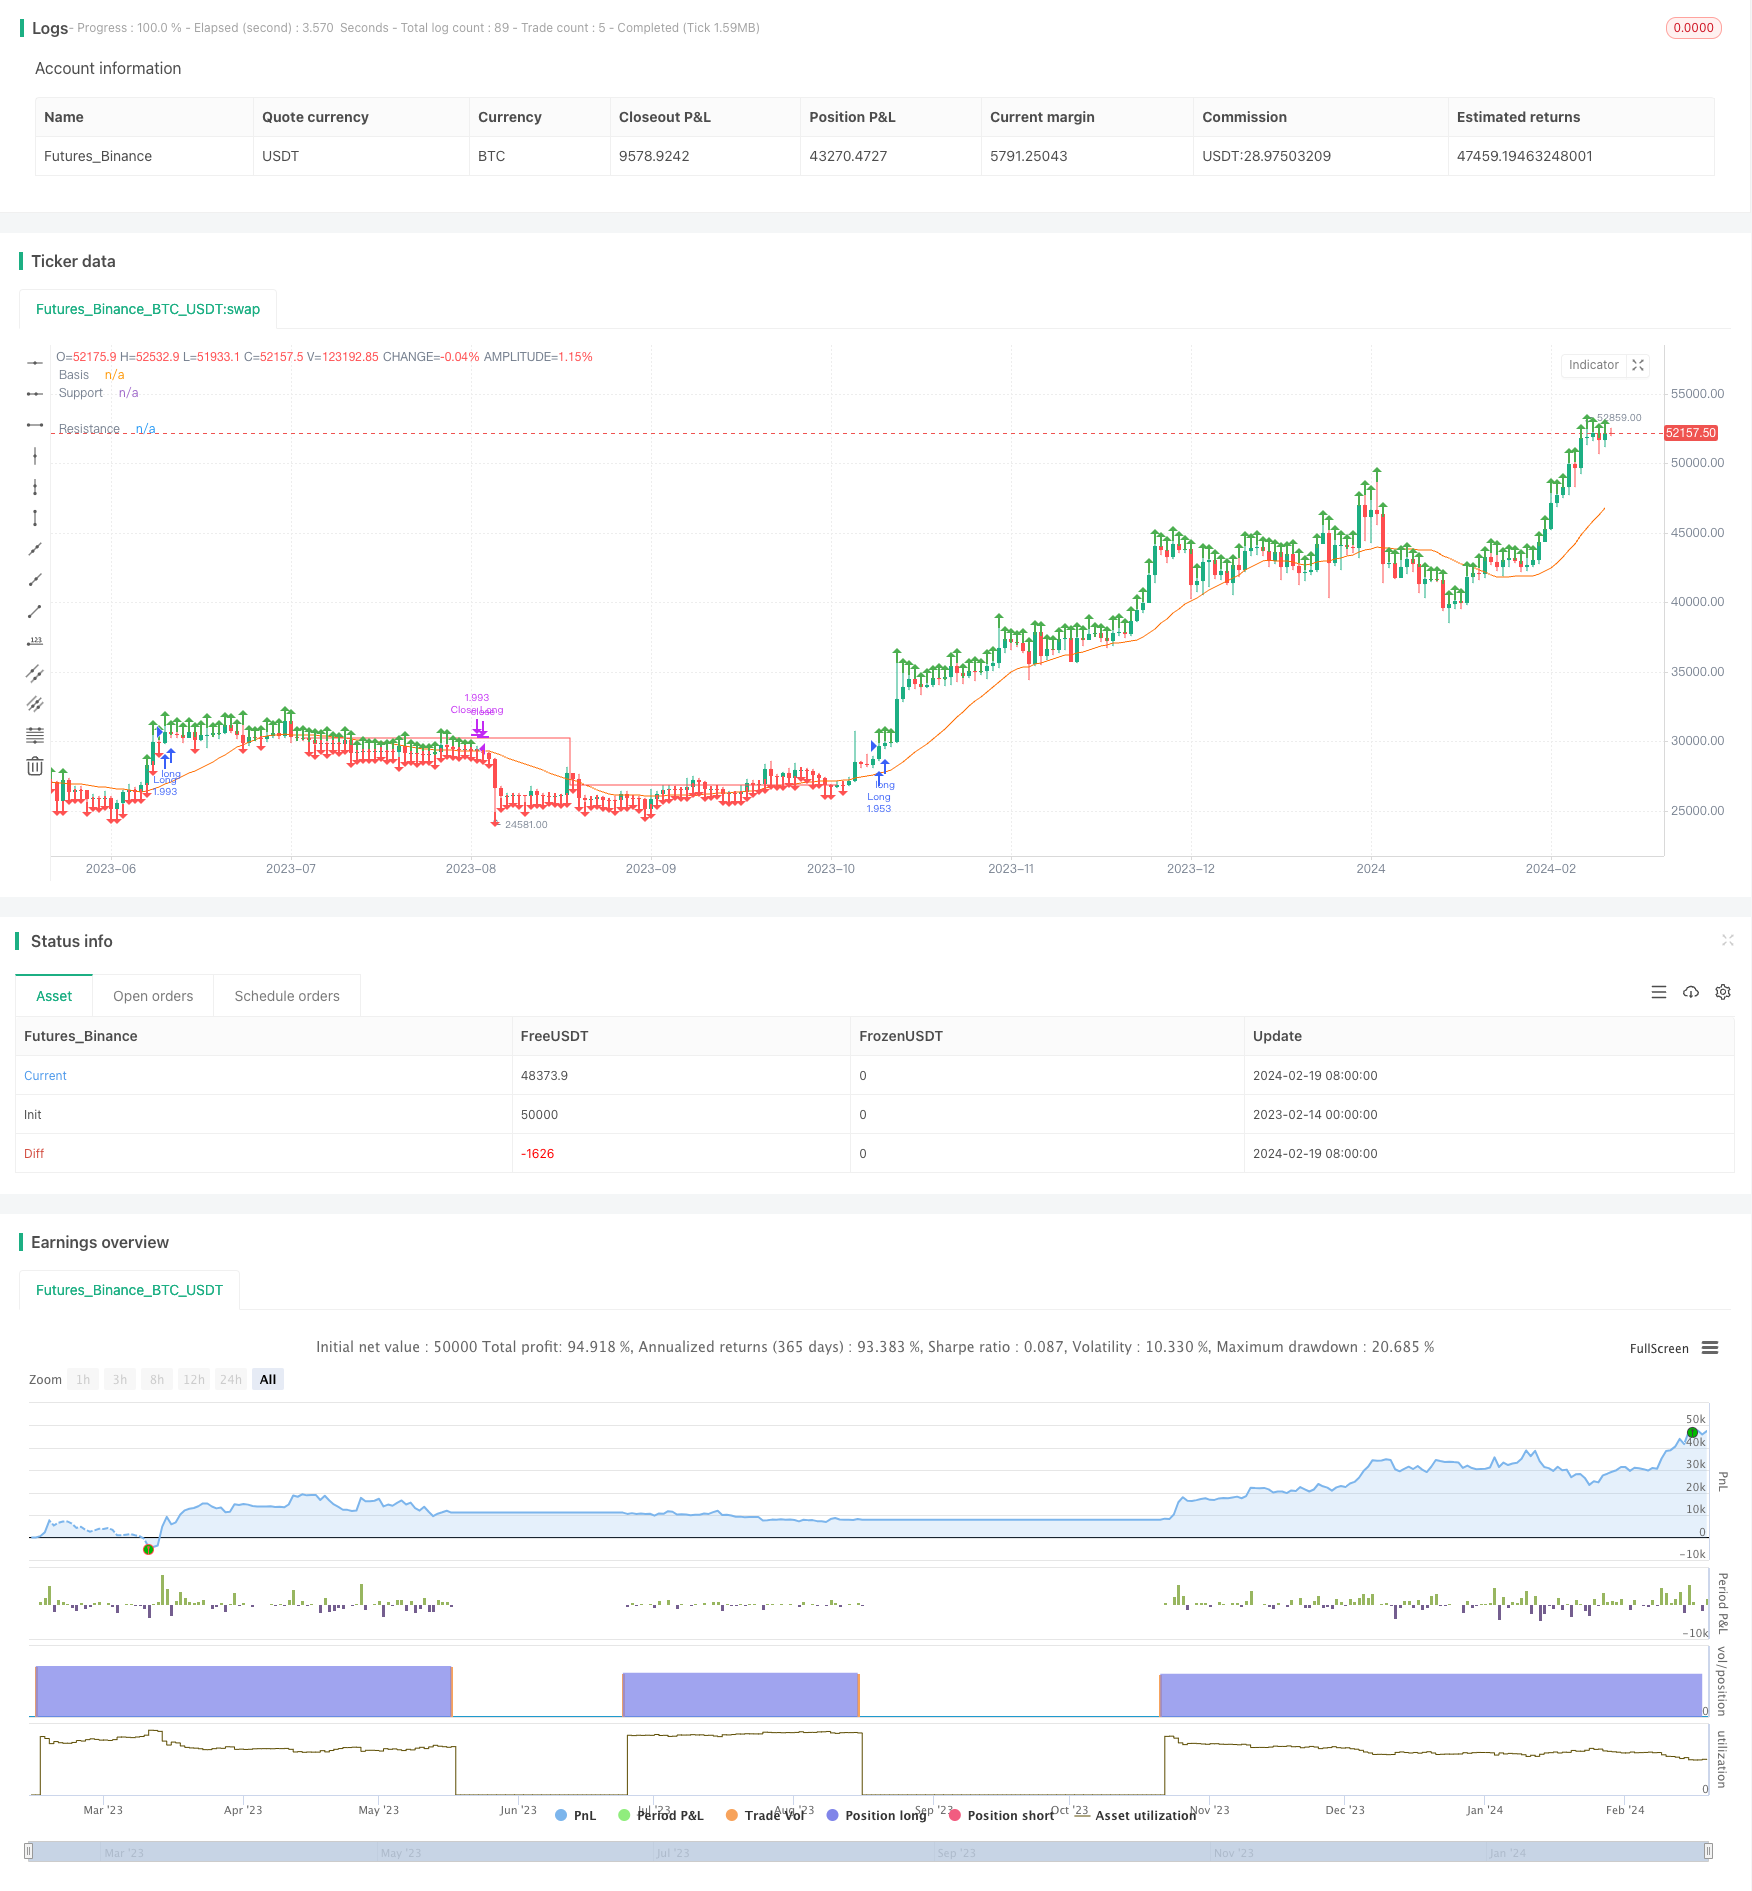
Chiến lược này là một chiến lược nắm giữ đường dài dựa trên đường trung bình di chuyển đơn giản để xác định hướng xu hướng, kết hợp với đường hỗ trợ kháng cự để tạo ra tín hiệu phá vỡ. Bằng cách tính toán điểm cao và điểm thấp của giá Pivot, vẽ đường kháng cự và đường hỗ trợ.
Nguyên tắc chiến lược
- Tính toán đường trung bình di chuyển đơn giản 20 ngày như một đường viền để đánh giá xu hướng
- Tính Pivot High và Pivot Low dựa trên các tham số đầu vào của người dùng
- Vẽ đường kháng cự và đường hỗ trợ dựa trên điểm cao Pivot và điểm thấp Pivot
- Khi giá đóng cửa cao hơn đường kháng cự, hãy tham gia nhiều hơn
- Khi hỗ trợ vượt qua đường kháng cự
Chiến lược này sử dụng đường trung bình di chuyển đơn giản để xác định hướng xu hướng tổng thể, sau đó sử dụng điểm mấu chốt để tạo ra tín hiệu giao dịch, thuộc loại chiến lược đột phá điển hình. Bằng cách đánh giá điểm mấu chốt và xu hướng, bạn có thể lọc hiệu quả các đột phá giả.
Phân tích lợi thế
- Có rất nhiều cơ hội chiến lược, phù hợp với các cổ phiếu biến động cao, dễ dàng nắm bắt xu hướng
- Kiểm soát rủi ro to do, rủi ro cao hơn lợi nhuận
- Sử dụng tín hiệu đột nhập để tránh nguy cơ đột nhập giả
- Các tham số có thể tùy chỉnh, có khả năng thích ứng
Phân tích rủi ro
- Tùy thuộc vào tối ưu hóa tham số, tham số không đúng sẽ làm tăng khả năng đột phá giả
- Có thể bị mất một số cơ hội.
- Thất bại dễ xảy ra trong động đất
- Không điều chỉnh đường hỗ trợ kịp thời có thể dẫn đến tổn thất
Có thể giảm rủi ro bằng cách tối ưu hóa các tham số trên ổ cứng, kết hợp với chiến lược dừng lỗ.
Hướng tối ưu hóa
- Tối ưu hóa tham số chu kỳ trung bình di chuyển
- Tối ưu hóa tham số đường kháng cự hỗ trợ
- Tăng chiến lược dừng lỗ
- Tăng cơ chế xác nhận đột phá
- Các chỉ số lọc kết hợp với khối lượng giao dịch
Tóm tắt
Chiến lược tổng thể là một chiến lược đột phá điển hình, dựa trên tối ưu hóa tham số và tính thanh khoản, phù hợp với các nhà giao dịch theo dõi xu hướng. Là một khung tham chiếu, có thể mở rộng mô-đun theo nhu cầu thực tế, giảm rủi ro và tăng sự ổn định thông qua các cơ chế như dừng lỗ, lọc tín hiệu.
/*backtest
start: 2023-02-14 00:00:00
end: 2024-02-20 00:00:00
period: 1d
basePeriod: 1h
exchanges: [{"eid":"Futures_Binance","currency":"BTC_USDT"}]
*/

// This source code is subject to the terms of the Mozilla Public License 2.0 at https://mozilla.org/MPL/2.0/
// © CheatCode1

//@version=5
strategy("Quantitative Trend Strategy- Uptrend long", 'Steady Uptrend Strategy', overlay=true, initial_capital = 1500, default_qty_value = 100, commission_type = strategy.commission.percent, commission_value = 0.01, default_qty_type = strategy.percent_of_equity)


length = input.int(20, minval=1)
src = input(close, title="Source")
basis = ta.sma(src, length)
offset = input.int(0, "Offset", minval = -500, maxval = 500)
plot(basis, "Basis", color=#FF6D00, offset = offset)

inp1 = input.int(46, 'LookbackLeft')
inp2 = input.int(32, 'LookbackRight')

l1 = ta.pivothigh(close, inp1, inp2)
S1 = ta.pivotlow(close, inp1, inp2)

// plot(l1, 'Pivothigh', color.red, 1)
// // plot(S1, 'Pivot Low', color.red)

l1V = ta.valuewhen(l1, close, 0)
S1V = ta.valuewhen(S1, close, 0)

Plotl1 = not na(l1) ? l1V : na
PlotS1 = not na(S1) ? S1V : na

plot(Plotl1, 'Resistance', color.green, 1, plot.style_stepline, true)
plot(PlotS1, 'Support', color.red, 1, plot.style_stepline, true)

Priceforlong = close > l1V ? true : na
Priceforshort = close < S1V ? true : na

plotshape(Priceforlong ? high : na, 'p', shape.arrowup, location.abovebar, color.green, size = size.small)
plotshape(Priceforshort ? low : na, 's', shape.arrowdown, location.belowbar, color.red, size = size.small)

vol = volume
volma = ta.sma(vol, 20)

Plotl1C = ta.valuewhen(na(Plotl1), l1V, 0)
PlotS1C = ta.valuewhen(na(PlotS1), S1V, 0)
//Strategy Execution
volc = volume > volma

Lc1 = Priceforlong

Sc1 = Priceforshort

sL = Plotl1 < PlotS1 ? close : na
sS = PlotS1 > Plotl1 ? close : na


if Lc1
    strategy.entry('Long', strategy.long)
// if Sc1 and C2
//     strategy.entry('Short', strategy.short)

if Priceforshort
    strategy.cancel('Long')
if Priceforlong
    strategy.cancel('Short')


// Stp1 = ta.crossover(k, d)
// Ltp1 = ta.crossunder(k, d)
// Ltp = d > 70  ? Ltp1 : na
// Stp = d < 30  ? Stp1 : na


if strategy.openprofit >= 0 and sL
    strategy.close('Long')
if strategy.openprofit >= 0 and sS
    strategy.close('Short')
takeP = input.float(2, title='Take Profit') / 100
stopL = input.float(1.75, title='Stop Loss') / 100


// // Pre Directionality

Stop_L = strategy.position_avg_price * (1 - stopL)

Stop_S = strategy.position_avg_price * (1 + stopL)

Take_S= strategy.position_avg_price * (1 - takeP)

Take_L = strategy.position_avg_price * (1 + takeP)

// sL = Plotl1 < PlotS1 ? close : na
// sS = PlotS1 < Plotl1 ? close : na

// //Post Excecution
if strategy.position_size > 0 and not (Lc1)
    strategy.exit("Close Long", stop = Stop_L, limit = Take_L)

if strategy.position_size < 0 and not (Sc1)
    strategy.exit("Close Short", stop = Stop_S, limit = Take_S)