Chiến lược giao dịch phá vỡ dải Bollinger
Ngày tạo:
2024-02-21 11:35:14
sửa đổi lần cuối:
2024-02-21 11:35:14
sao chép:
0
Số nhấp chuột:
726
1
tập trung vào
1750
Người theo dõi
Tổng quan
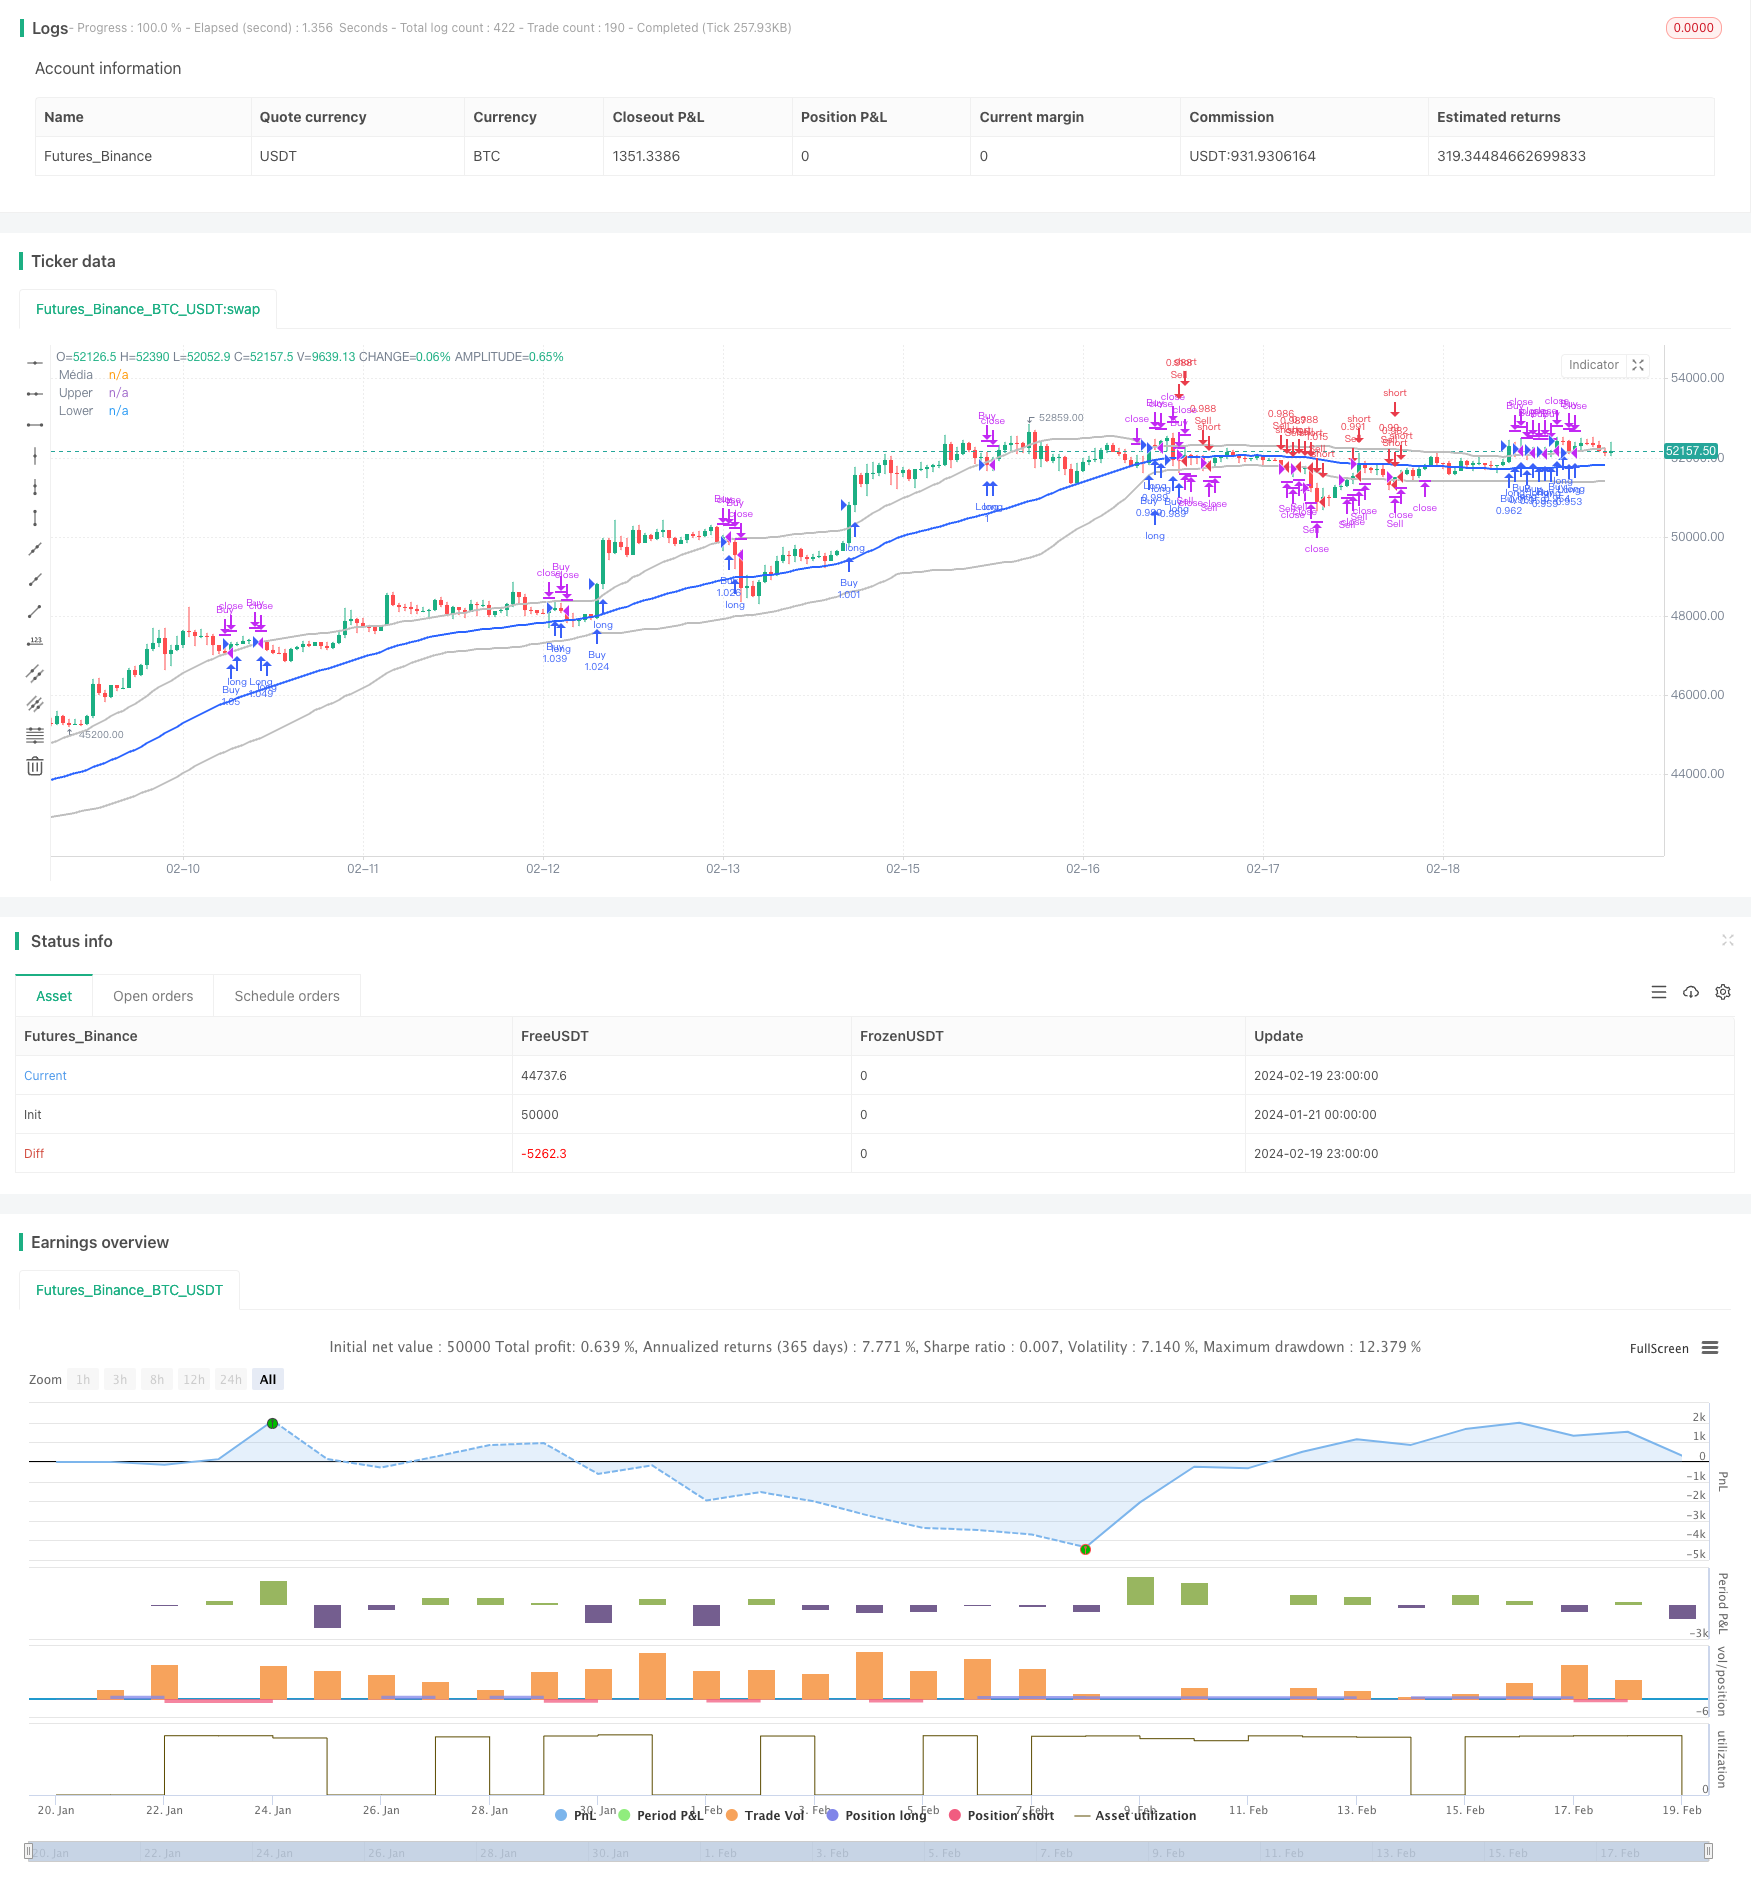
Chiến lược này dựa trên thiết kế của chỉ số Bollinger Bands, làm nhiều khi giá phá vỡ Bollinger Bands lên đường và bỏ trống khi giá phá vỡ Bollinger Bands xuống đường, thuộc chiến lược theo dõi xu hướng.
Nguyên tắc chiến lược
- Tính toán đường ray trung, đường ray trên và đường ray dưới của băng Brin
- Khi giá đóng cửa phá vỡ đường đua, hãy tham gia nhiều hơn
- Khi giá đóng cửa phá vỡ đường mòn, hãy tháo lỗ
- Điều kiện cân bằng: phá vỡ quỹ đạo trung bình bằng nhiều thẻ, phá vỡ quỹ đạo trung bình bằng thẻ trống
Chiến lược này đánh giá phạm vi dao động và hướng xu hướng của thị trường thông qua Bollinger Bands. Khi giá phá vỡ Bollinger Bands và đi xuống đường ray, nó được coi là tín hiệu đảo ngược xu hướng, theo tín hiệu này, nhập cảnh được thực hiện nhiều hơn.
Phân tích lợi thế
- Sử dụng chỉ số BRI để đánh giá xu hướng thị trường và mức kháng cự hỗ trợ
- Có nhiều cơ hội vượt qua Brin và xuống đường ray
- Có quy định rõ ràng về lối vào và lối ra
Phân tích rủi ro
- Brin có nguy cơ phá vỡ tín hiệu giả, có thể là biến động giá ngắn hạn
- Trong trường hợp lớn, lỗ hổng có thể lớn hơn.
Phương pháp giải quyết rủi ro:
- Xu hướng đánh giá kết hợp với các chỉ số khác
- Chuyển đổi tham số, mở rộng phạm vi Brin
Hướng tối ưu hóa
- Kết hợp các chỉ số xu hướng để tránh các hoạt động đảo ngược không cần thiết
- Động thái điều chỉnh các tham số Brin, tối ưu hóa kích thước tham số
Tóm tắt
Chiến lược này dùng các chỉ số Brin để xác định xu hướng giá cả và mức kháng cự hỗ trợ, vào điểm phá vỡ đường mòn dưới đường mòn trên đường dây Brin và điểm dừng là đường mòn giữa đường dây Brin. Lập luận của chiến lược đơn giản, rõ ràng và dễ thực hiện.
Mã nguồn chiến lược
/*backtest
start: 2024-01-21 00:00:00
end: 2024-02-20 00:00:00
period: 1h
basePeriod: 15m
exchanges: [{"eid":"Futures_Binance","currency":"BTC_USDT"}]
*/

//@version=5
strategy("FFFDBTC", overlay=true,initial_capital = 100,commission_type =strategy.commission.percent,commission_value= 0.15,default_qty_value = 100,default_qty_type = strategy.percent_of_equity)
// === INPUT BACKTEST RANGE ===
FromMonth = input.int(defval=1, title="From Month", minval=1, maxval=12)
FromDay = input.int(defval=1, title="From Day", minval=1, maxval=31)
FromYear = input.int(defval=1972, title="From Year", minval=1972)
ToMonth = input.int(defval=1, title="To Month", minval=1, maxval=12)
ToDay = input.int(defval=1, title="To Day", minval=1, maxval=31)
ToYear = input.int(defval=9999, title="To Year", minval=2010)

// === FUNCTION EXAMPLE ===
start = timestamp(FromYear, FromMonth, FromDay, 00, 00)  // backtest start window
finish = timestamp(ToYear, ToMonth, ToDay, 23, 59)  // backtest finish window
window() => true
// Definindo tamanho da posição
position_size = strategy.equity
// Definir parâmetros das Bandas de Bollinger
length = input.int(51, "Comprimento")
mult = input.float(1.1, "Multiplicador")

// Calcular as Bandas de Bollinger
basis = ta.sma(close, length)
dev = mult * ta.stdev(close, length)
upper = basis + dev
lower = basis - dev
// Definir condições de entrada e saída
entrada_na_venda = low < lower
saida_da_venda = high > lower and strategy.position_size < 0
entrada_na_compra = high > upper
saida_da_compra = low < upper and strategy.position_size > 0
shortCondition = close[1] < lower[1] and close > lower and close < basis
longCondition = close[1] > upper[1] and close < upper and close > basis

// Entrar na posição longa se a condição longCondition for verdadeira
if ((entrada_na_compra) and window() )
    strategy.entry("Buy", strategy.long)
//saida da compra
if (saida_da_compra)
    strategy.close("Buy")
//entrada na venda
if ((entrada_na_venda) and window() )
    strategy.entry("Sell", strategy.short)
//saida da venda
if (saida_da_venda)
    strategy.close("Sell")
if ((longCondition) and window())
    strategy.entry("Long", strategy.long)

// Entrar na posição curta se a condição shortCondition for verdadeira
if ((shortCondition) and window())
    strategy.entry("Short", strategy.short)

// Definir a saída da posição

strategy.exit("Exit_Long", "Long", stop=ta.sma(close, length), when = close >= basis)
strategy.exit("Exit_Short", "Short", stop=ta.sma(close, length), when = close <= basis)

// Desenhar as Bandas de Bollinger no gráfico
plot(basis, "Média", color=#2962FF, linewidth=2)
plot(upper, "Upper", color=#BEBEBE, linewidth=2)
plot(lower, "Lower", color=#BEBEBE, linewidth=2)