Dựa trên động lực theo dõi và chiến lược xu hướng
Tổng quan
Ý tưởng cốt lõi của chiến lược này là kết hợp chỉ số xu hướng siêu và chỉ số xu hướng trung bình ((ADX), để đánh giá và theo dõi xu hướng. Chỉ số xu hướng siêu được sử dụng để xác định hướng xu hướng giá hiện tại, ADX được sử dụng để đánh giá cường độ xu hướng và chỉ giao dịch dưới xu hướng mạnh. Ngoài ra, chiến lược cũng sử dụng màu sắc thực thể K-line, chỉ số khối lượng giao dịch để xác nhận, tạo thành quy tắc giao dịch tương đối đầy đủ.
Nhìn chung, chiến lược này thuộc về chiến lược theo dõi xu hướng, nhằm mục đích nắm bắt xu hướng rõ ràng trong đường dài và trung bình, tránh bị nhiễu bởi sự cân bằng và biến động.
Nguyên tắc chiến lược
Sử dụng chỉ số siêu xu hướng để xác định hướng xu hướng giá. Khi giá đứng trên siêu xu hướng, nó là tín hiệu nhiều đầu, khi đứng dưới siêu xu hướng, nó là tín hiệu không đầu.
Sử dụng ADX để xác định cường độ của xu hướng. Chỉ khi ADX lớn hơn ngưỡng thiết lập, tín hiệu giao dịch sẽ được tạo ra, điều này có thể lọc các giai đoạn không rõ ràng.
K-line thực thể màu sắc phán đoán hiện tại là một hình thức tăng hoặc giảm, kết hợp với các chỉ số xu hướng siêu, hình thành xác nhận.
Khối lượng giao dịch tăng lên như là một tín hiệu xác nhận.
Thiết lập lệnh dừng lỗ và lệnh dừng để khóa lợi nhuận và kiểm soát rủi ro.
Xóa tất cả các vị trí trước khi hết thời gian trong đĩa được thiết lập.
Lợi thế chiến lược
Theo dõi xu hướng rõ ràng, tránh biến động, có thể đạt được tỷ lệ lợi nhuận cao hơn.
Các tham số chiến lược ít hơn, dễ hiểu và dễ thực hiện.
Có thể kiểm soát rủi ro, thiết lập dừng lỗ và chặn.
Việc sử dụng nhiều chỉ số để xác nhận có thể làm giảm tín hiệu sai.
Rủi ro chiến lược
Có thể sẽ có những tổn thất lớn hơn khi điều chỉnh độ sâu.
Những biến động trong kết quả của một cổ phiếu có thể gây ra sự đảo ngược mạnh mẽ.
Một số người khác cũng đã lên tiếng phản đối.
Giải pháp đối phó với rủi ro:
Điều chỉnh các tham số ADX để đảm bảo chỉ giao dịch khi có xu hướng mạnh.
Tăng mức dừng lỗ, kiểm soát tổn thất đơn lẻ.
Theo dõi chặt chẽ chính sách và các sự kiện quan trọng, chủ động ngăn chặn thiệt hại khi cần thiết.
Hướng tối ưu hóa chiến lược
Có thể thử nghiệm các kết hợp các tham số siêu xu hướng khác nhau, chọn tham số tạo ra tín hiệu ổn định hơn.
Các tham số khác nhau của ADX có thể được thử nghiệm để xác định sự kết hợp tham số tốt nhất.
Các chỉ số khác có thể được thêm vào để xác nhận, chẳng hạn như tỷ lệ dao động, Blink, v.v., để giảm thêm tín hiệu giả.
Có thể kết hợp các chiến lược như phá vỡ để dừng lỗ khi xu hướng bị phá vỡ.
Tóm tắt
Chiến lược này có ý tưởng tổng thể rõ ràng, đánh giá xu hướng xu hướng giá bằng xu hướng siêu, đánh giá cường độ xu hướng bằng ADX, theo dõi xu hướng trong xu hướng mạnh. Đồng thời thiết lập dừng lỗ để kiểm soát rủi ro. Các tham số chiến lược ít hơn, dễ dàng tối ưu hóa.
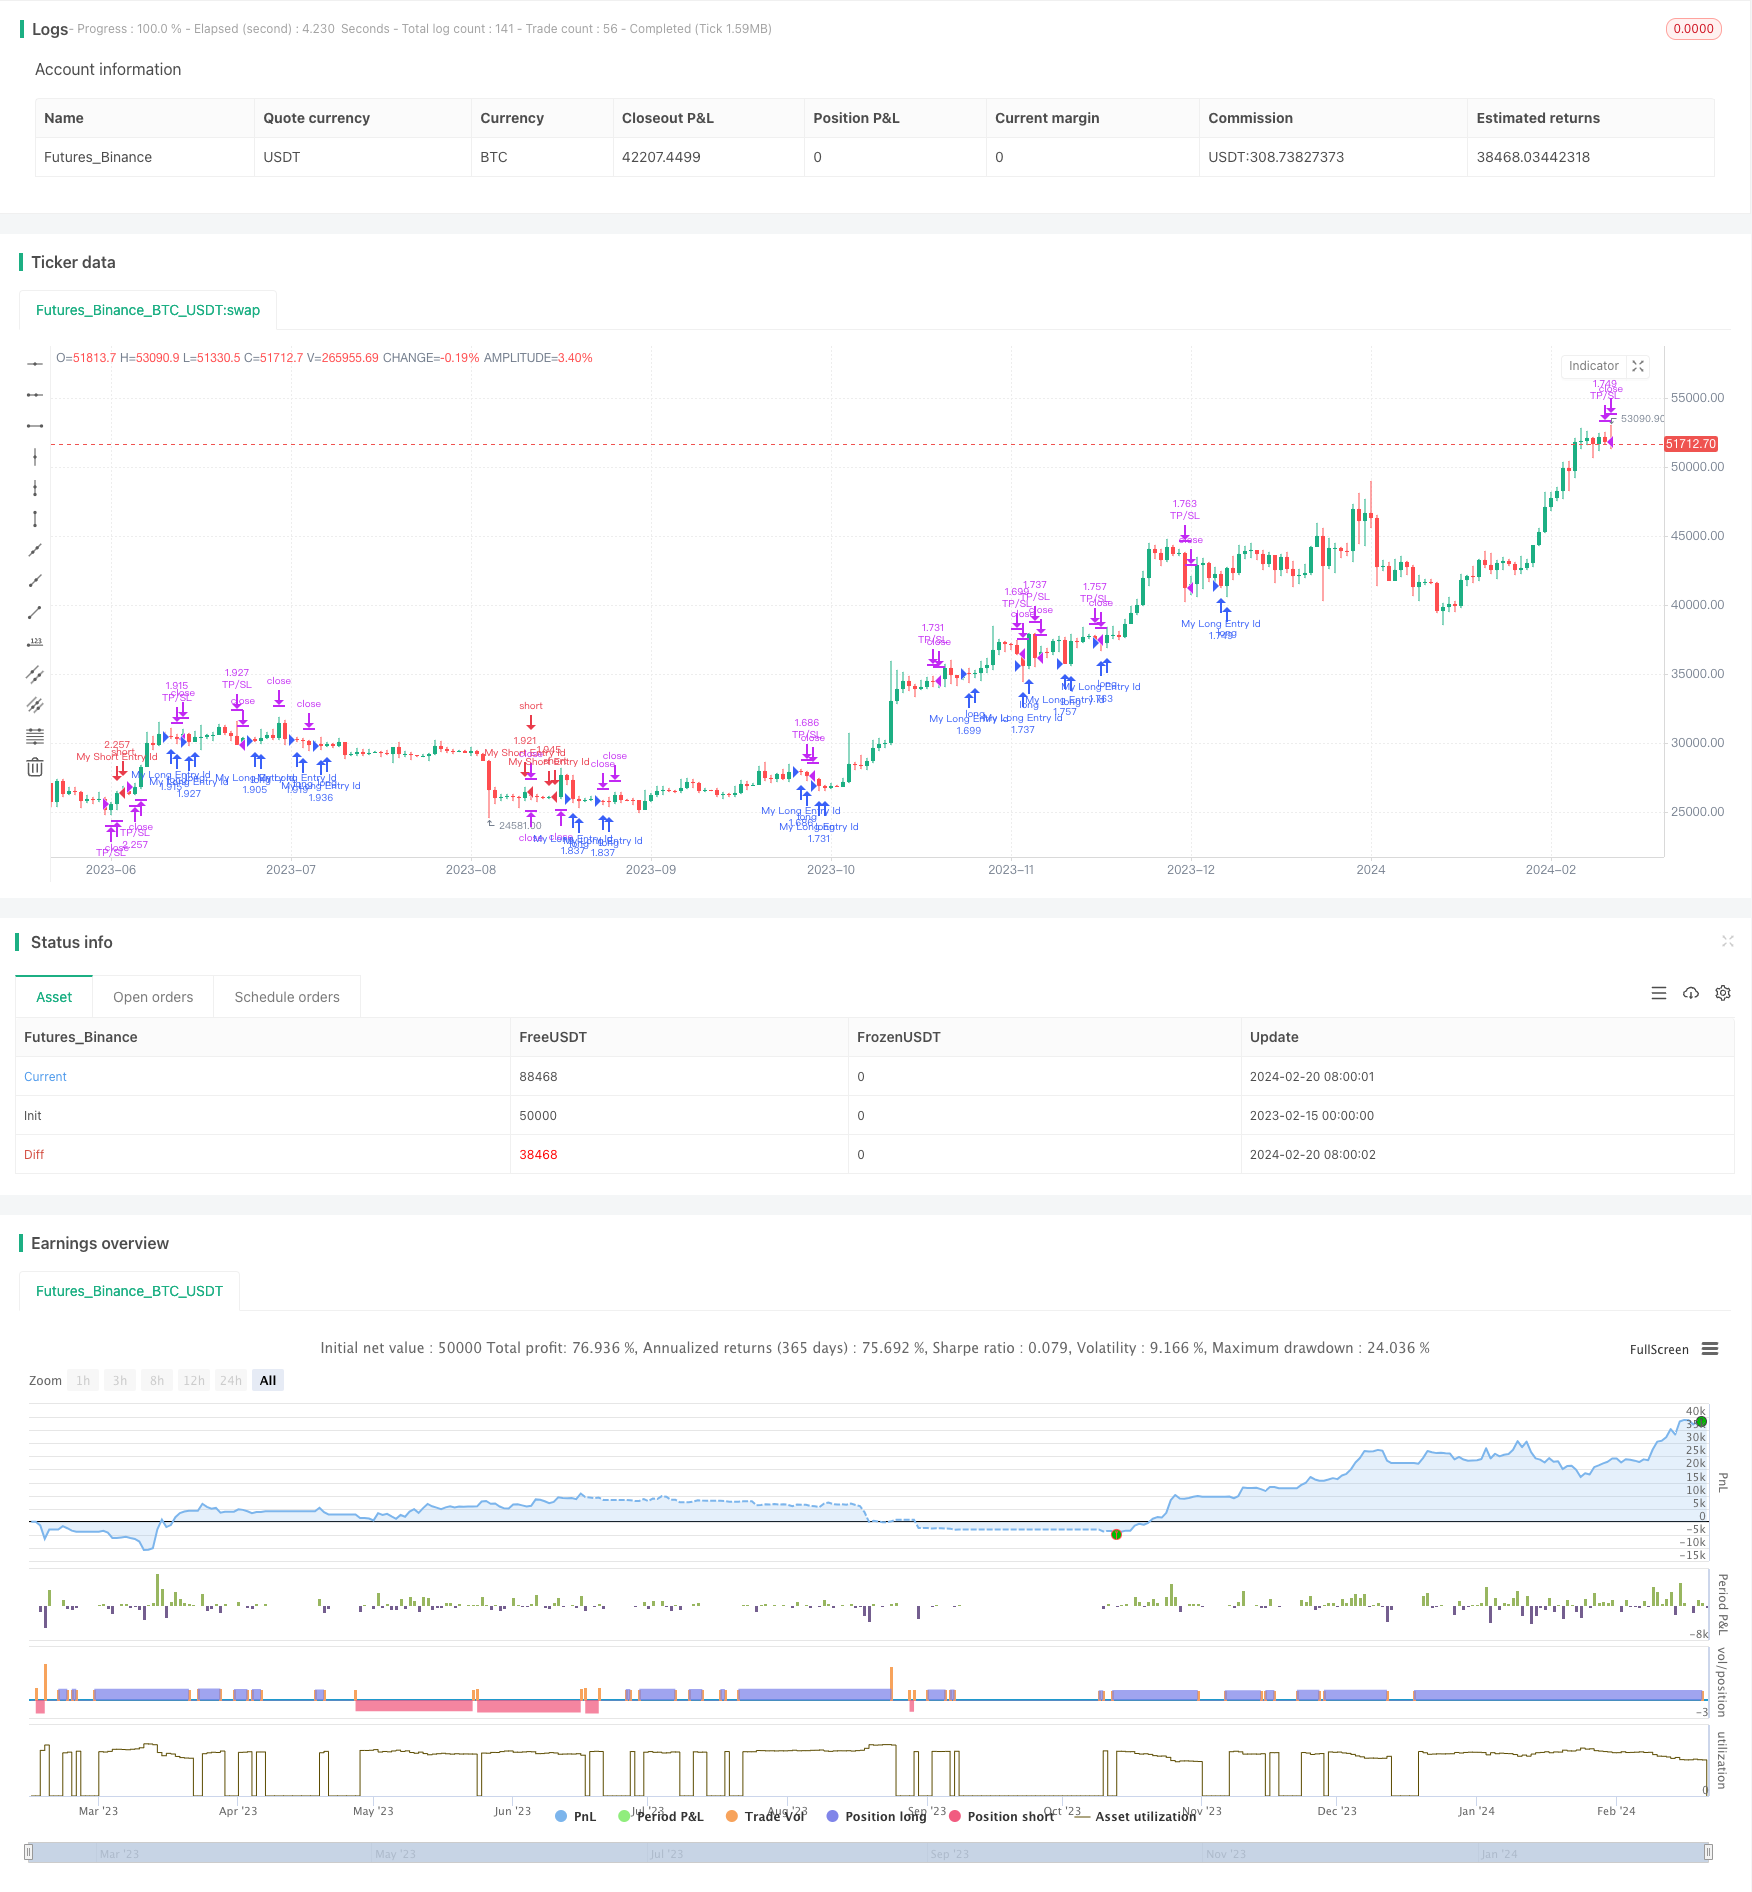
/*backtest
start: 2023-02-15 00:00:00
end: 2024-02-21 00:00:00
period: 1d
basePeriod: 1h
exchanges: [{"eid":"Futures_Binance","currency":"BTC_USDT"}]
*/

//Intraday Strategy Template

// This source code is subject to the terms of the Mozilla Public License 2.0 at https://mozilla.org/MPL/2.0/
// © vikris

//@version=4
strategy("[VJ]Hulk Smash Intra", overlay=true, calc_on_every_tick = false, pyramiding=0,default_qty_type=strategy.percent_of_equity, default_qty_value=100,initial_capital=2000)

// ********** Strategy inputs - Start **********

// Used for intraday handling
// Session value should be from market start to the time you want to square-off
// your intraday strategy
// Important: The end time should be at least 2 minutes before the intraday
// square-off time set by your broker
var i_marketSession = input(title="Market session", type=input.session,
     defval="0915-1455", confirm=true)

// Make inputs that set the take profit % (optional)
longProfitPerc = input(title="Long Take Profit (%)",
     type=input.float, minval=0.0, step=0.1, defval=1) * 0.01

shortProfitPerc = input(title="Short Take Profit (%)",
     type=input.float, minval=0.0, step=0.1, defval=1) * 0.01

// Set stop loss level with input options (optional)
longLossPerc = input(title="Long Stop Loss (%)",
     type=input.float, minval=0.0, step=0.1, defval=0.5) * 0.01

shortLossPerc = input(title="Short Stop Loss (%)",
     type=input.float, minval=0.0, step=0.1, defval=0.5) * 0.01

var float i_multiplier = input(title = "ST Multiplier", type = input.float,
     defval = 2, step = 0.1, confirm=true)

var int i_atrPeriod = input(title = "ST ATR Period", type = input.integer,
     defval = 10, confirm=true)

len = input(title="ADX Length", type=input.integer, defval=14)
th = input(title="ADX Threshold", type=input.integer, defval=20)
adxval = input(title="ADX Momemtum Value", type=input.integer, defval=25)


// ********** Strategy inputs - End **********


// ********** Supporting functions - Start **********

// A function to check whether the bar or period is in intraday session
barInSession(sess) => time(timeframe.period, sess) != 0

// ********** Supporting functions - End **********


// ********** Strategy - Start **********

[superTrend, dir] = supertrend(i_multiplier, i_atrPeriod)

colResistance = dir == 1 and dir == dir[1] ? color.new(color.red, 0) : color.new(color.red, 100)
colSupport = dir == -1 and dir == dir[1] ? color.new(color.green, 0) : color.new(color.green, 100)


// Super Trend Long/short condition
stlong = close > superTrend
stshort = close < superTrend


// Figure out take profit price
longExitPrice  = strategy.position_avg_price * (1 + longProfitPerc)
shortExitPrice = strategy.position_avg_price * (1 - shortProfitPerc)

// Determine stop loss price
longStopPrice  = strategy.position_avg_price * (1 - longLossPerc)
shortStopPrice = strategy.position_avg_price * (1 + shortLossPerc)

//Vol Confirmation
vol = volume > volume[1]


//Candles colors
greenCandle = (close > open)
redCandle = (close < open)

// See if intraday session is active
bool intradaySession = barInSession(i_marketSession)

// Trade only if intraday session is active


TrueRange = max(max(high - low, abs(high - nz(close[1]))), abs(low - nz(close[1])))
DirectionalMovementPlus = high - nz(high[1]) > nz(low[1]) - low ? max(high - nz(high[1]), 0) : 0
DirectionalMovementMinus = nz(low[1]) - low > high - nz(high[1]) ? max(nz(low[1]) - low, 0) : 0


SmoothedTrueRange = 0.0
SmoothedTrueRange := nz(SmoothedTrueRange[1]) - nz(SmoothedTrueRange[1]) / len + TrueRange
SmoothedDirectionalMovementPlus = 0.0
SmoothedDirectionalMovementPlus := nz(SmoothedDirectionalMovementPlus[1]) -
   nz(SmoothedDirectionalMovementPlus[1]) / len + DirectionalMovementPlus
SmoothedDirectionalMovementMinus = 0.0
SmoothedDirectionalMovementMinus := nz(SmoothedDirectionalMovementMinus[1]) -
   nz(SmoothedDirectionalMovementMinus[1]) / len + DirectionalMovementMinus

DIPlus = SmoothedDirectionalMovementPlus / SmoothedTrueRange * 100
DIMinus = SmoothedDirectionalMovementMinus / SmoothedTrueRange * 100
DX = abs(DIPlus - DIMinus) / (DIPlus + DIMinus) * 100
ADX = sma(DX, len)

// a = plot(DIPlus, color=color.green, title="DI+", transp=100)
// b = plot(DIMinus, color=color.red, title="DI-", transp=100)

//Final Long/Short Condition
longCondition = stlong and redCandle and vol and ADX>adxval
shortCondition = stshort and greenCandle and vol and ADX >adxval


//Long Strategy - buy condition and exits with Take profit and SL
if (longCondition and intradaySession)
    stop_level = longStopPrice
    profit_level = longExitPrice
    strategy.entry("My Long Entry Id", strategy.long)
    strategy.exit("TP/SL", "My Long Entry Id",stop=stop_level, limit=profit_level)


//Short Strategy - sell condition and exits with Take profit and SL
if (shortCondition and intradaySession)
    stop_level = shortStopPrice
    profit_level = shortExitPrice
    strategy.entry("My Short Entry Id", strategy.short)
    strategy.exit("TP/SL", "My Short Entry Id", stop=stop_level, limit=profit_level)


// Square-off position (when session is over and position is open)
squareOff = (not intradaySession) and (strategy.position_size != 0)
strategy.close_all(when = squareOff, comment = "Square-off")

// ********** Strategy - End **********