Chiến lược đột biến xu hướng lịch sử
Tổng quan
Chiến lược lôi kéo xu hướng lịch sử sử dụng chỉ số xoay chuyển để xác định điểm đảo ngược xu hướng thị trường, kết hợp với chỉ số di chuyển trung bình để tạo ra tín hiệu giao dịch, nhằm mục đích nắm bắt các hành động ủng hộ. Chiến lược này kết hợp một cách khéo léo lợi thế của việc sử dụng chỉ số xoay chuyển và trung bình di chuyển, có thể xác định hiệu quả xu hướng thị trường và cung cấp hướng dẫn giao dịch.
Phân tích
Chỉ số dòng chảy- Xác định hướng và cường độ của xu hướng bằng cách phân tích chuyển động tích cực và chuyển động tiêu cực của giá. Các tham số chính bao gồm độ dài chu kỳ, nhân và giá trị giảm.
Chỉ số di chuyển trung bình- Đơn giản hóa chỉ số cho giá đóng cửa, cung cấp phán đoán xu hướng trôi chảy hơn.
Chiến lược này sử dụng các chỉ số dòng chảy xoáy để xác định hướng xu hướng chính của thị trường, tạo ra tín hiệu giao dịch khi đường chỉ số vượt qua ngưỡng. Lưu trữ các tín hiệu lọc, tránh các tín hiệu sai. Cụ thể, tạo ra tín hiệu mua khi chỉ số dòng chảy xoáy đi lên vượt qua ngưỡng và giá cao hơn trung bình di chuyển; tạo ra tín hiệu bán khi chỉ số dòng chảy xoáy đi xuống vượt qua ngưỡng và giá thấp hơn trung bình di chuyển.
Phân tích lợi thế
- Sử dụng khả năng nhận diện đảo ngược của chỉ số dòng chảy để nắm bắt cơ hội đảo ngược xu hướng tiềm năng
- Trình lọc tín hiệu kết hợp với đường trung bình di chuyển để tránh giao dịch sai trong tình huống chấn động
- Có thể tối ưu hóa thông qua các tham số, điều chỉnh độ nhạy của chiến lược để phù hợp với các môi trường thị trường khác nhau
- Giao diện trực quan và tín hiệu giao dịch rõ ràng, thuận tiện cho hoạt động thực tế
Phân tích rủi ro
- Cần cảnh giác với các sự cố bất ngờ gây ra nguy cơ hệ thống không hiệu quả của chỉ số
- Có thể có nhiều tín hiệu sai trong các trận động đất
- Thiết lập tham số không đúng cũng có thể dẫn đến quá cực đoan hoặc bảo thủ
- Cần kết hợp với các lỗ hổng thích hợp để kiểm soát tổn thất đơn lẻ
Đối với các rủi ro, có thể đáp ứng bằng cách thêm bộ lọc bổ sung, kết hợp nhiều chỉ số phán đoán, thiết lập tham số tối ưu hóa và thiết lập lỗ hổng thích hợp.
Hướng tối ưu hóa
- Thử các loại trung bình di chuyển khác nhau để tìm sự kết hợp phù hợp nhất
- Điều chỉnh các tham số của chỉ số dòng chảy xoắn và trung bình di chuyển để đạt được lợi nhuận tối ưu
- Kiểm tra sự ổn định của chiến lược trên nhiều chu kỳ thời gian
- Thêm các dấu hiệu lọc như Blink
- Điều chỉnh tham số cho các giống cụ thể
Tóm tắt
Chiến lược lôi kéo thay đổi xu hướng lịch sử nói chung là khá ổn định, có khả năng lọc trong khi nắm bắt xu hướng tiềm năng. Với sự hỗ trợ của tối ưu hóa tham số và quản lý rủi ro, chiến lược này có thể đạt được tỷ lệ lợi nhuận xuất sắc hơn.
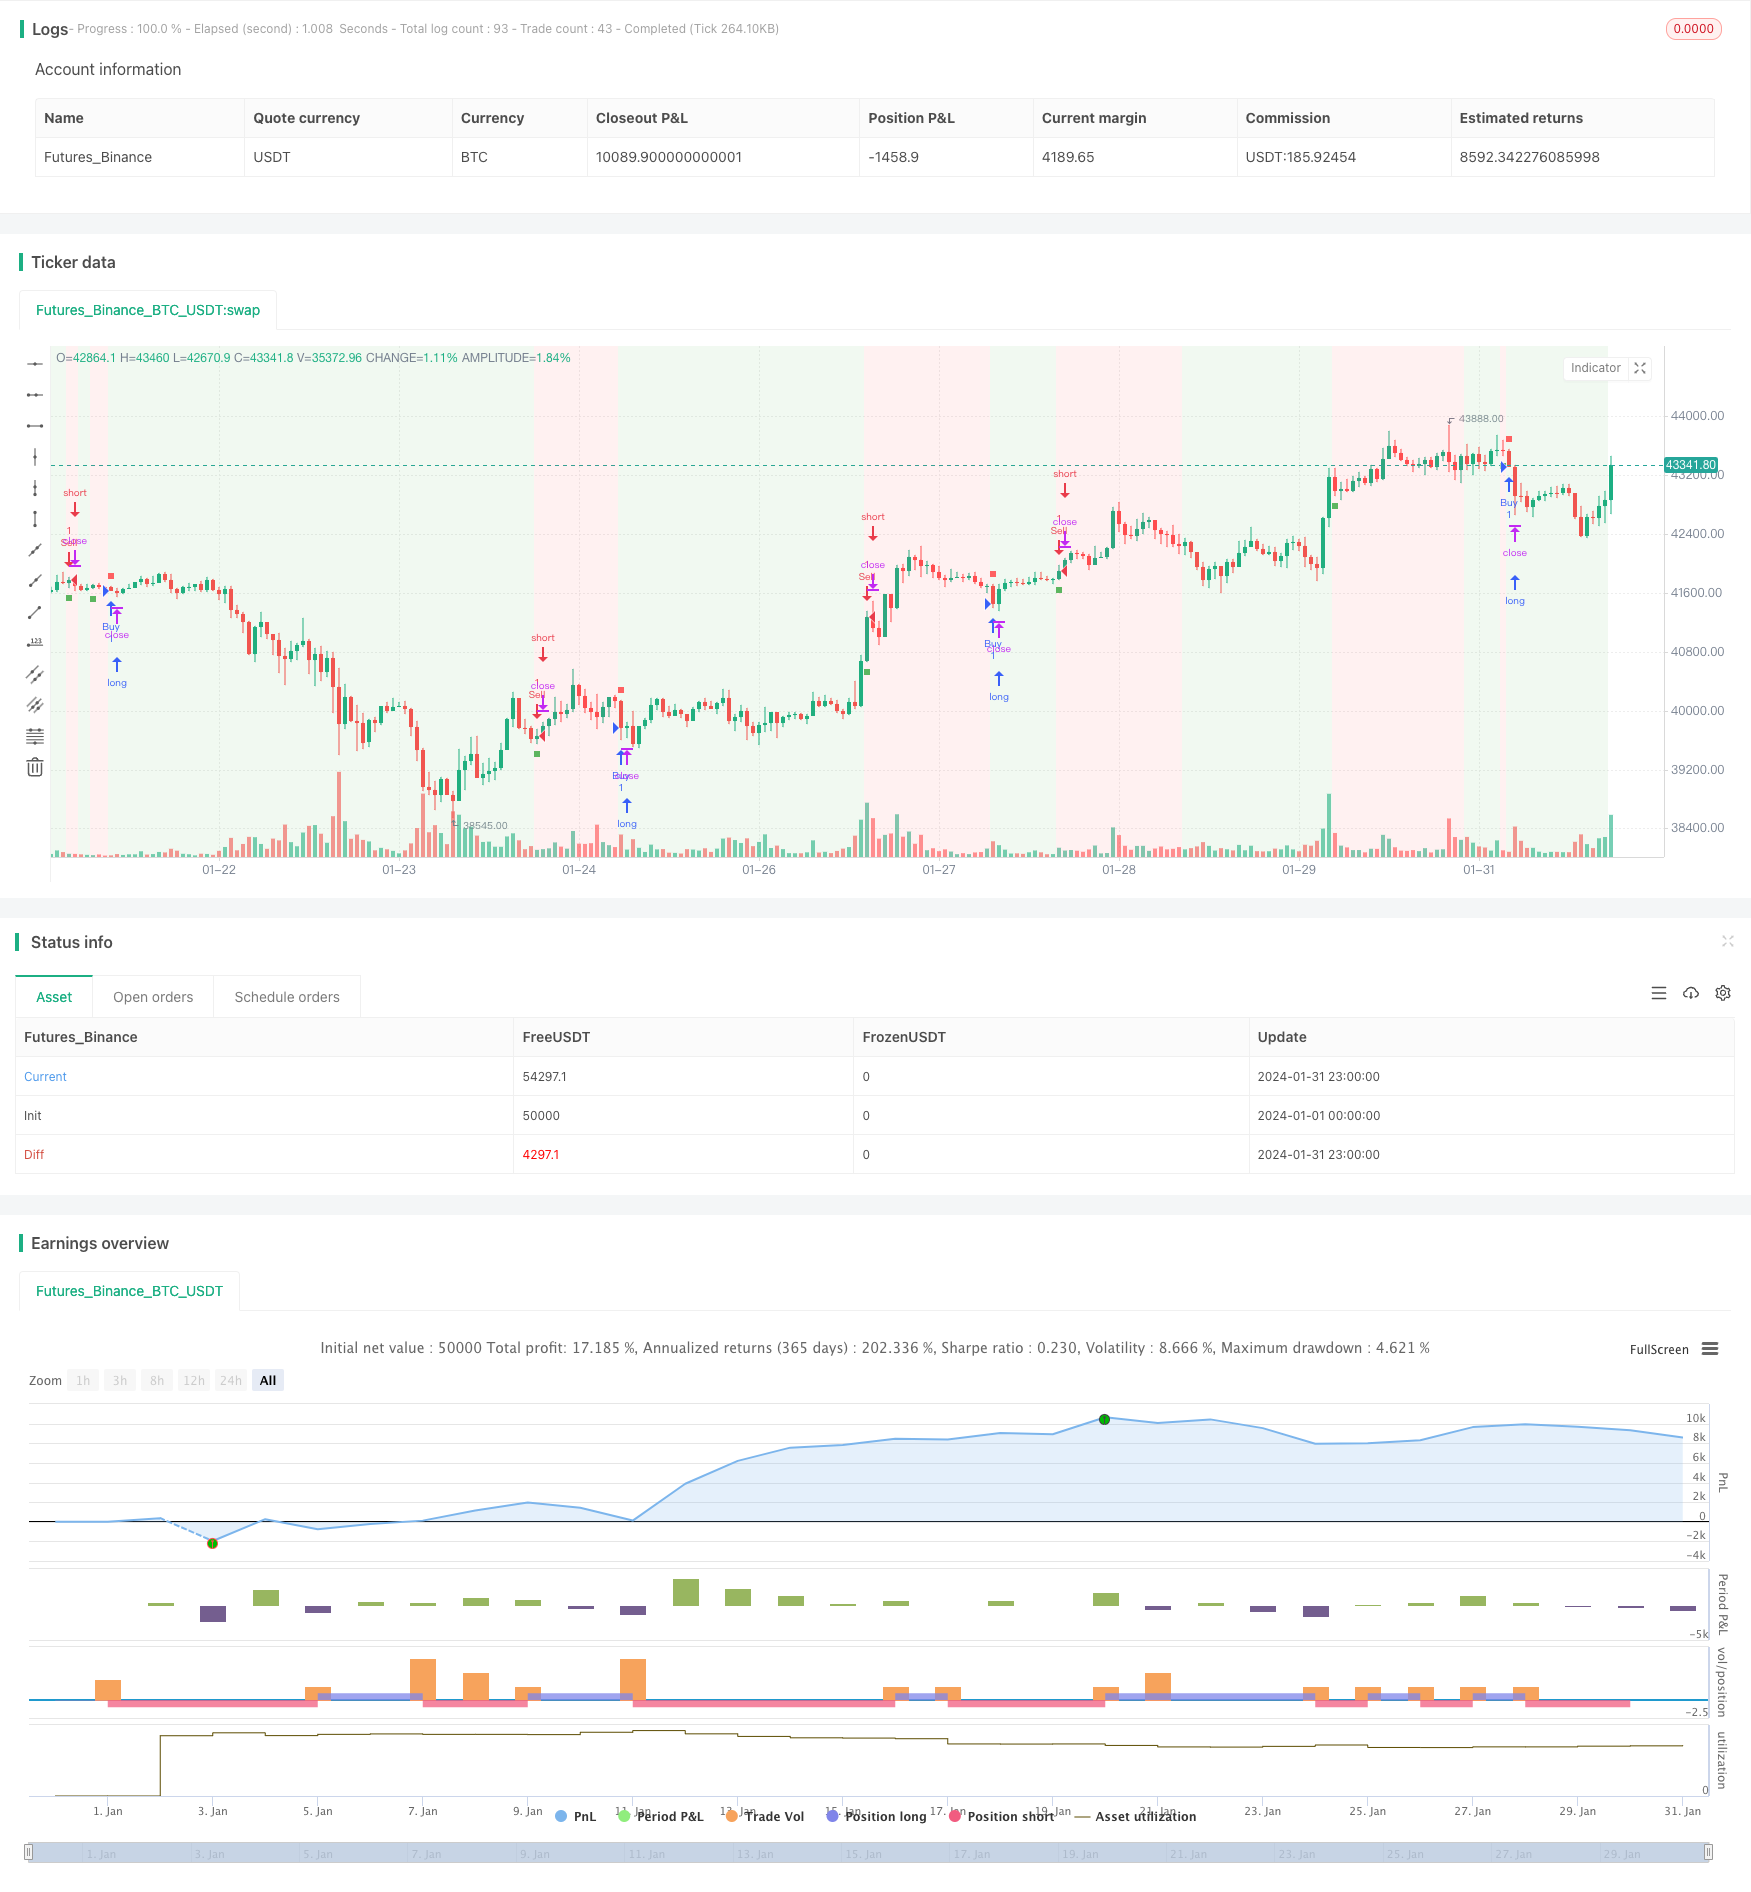
/*backtest
start: 2024-01-01 00:00:00
end: 2024-01-31 23:59:59
period: 1h
basePeriod: 15m
exchanges: [{"eid":"Futures_Binance","currency":"BTC_USDT"}]
*/

// This work is licensed under a Attribution-NonCommercial-ShareAlike 4.0 International (CC BY-NC-SA 4.0) https://creativecommons.org/licenses/by-nc-sa/4.0/
// © AstroHub

//@version=5
strategy("Vortex Strategy [AstroHub]", shorttitle="VS [AstroHub]", overlay=true)

// Vortex Indicator Settings
length = input(14, title="Length", group ="AstroHub Vortex Strategy", tooltip="Number of bars used in the Vortex Indicator calculation. Higher values may result in smoother but slower responses to price changes.")
mult = input(1.0, title="Multiplier", group ="AstroHub Vortex Strategy", tooltip="Multiplier for the Vortex Indicator calculation. Adjust to fine-tune the sensitivity of the indicator to price movements.")
threshold = input(0.5, title="Threshold",group ="AstroHub Vortex Strategy",  tooltip="Threshold level for determining the trend. Higher values increase the likelihood of a trend change being identified.")
emaLength = input(20, title="EMA Length", group ="AstroHub Vortex Strategy", tooltip="Length of the Exponential Moving Average (EMA) used in the strategy. A longer EMA may provide a smoother trend indication.")

// Calculate Vortex Indicator components
a = math.abs(close - close[1])
b = close - ta.sma(close, length)
shl = ta.ema(b, length)
svl = ta.ema(a, length)

// Determine trend direction
upTrend = shl > svl
downTrend = shl < svl

// Define Buy and Sell signals
buySignal = ta.crossover(shl, svl) and close > ta.ema(close, emaLength) and (upTrend != upTrend[1])
sellSignal = ta.crossunder(shl, svl) and close < ta.ema(close, emaLength) and (downTrend != downTrend[1])

// Execute strategy based on signals
strategy.entry("Sell", strategy.short, when=buySignal)
strategy.entry("Buy", strategy.long, when=sellSignal)

// Background color based on the trend
bgcolor(downTrend ? color.new(color.green, 90) : upTrend ? color.new(color.red, 90) : na)

// Plot Buy and Sell signals with different shapes and colors
buySignal1 = ta.crossover(shl, svl) and close > ta.ema(close, emaLength)
sellSignal1 = ta.crossunder(shl, svl) and close < ta.ema(close, emaLength)

plotshape(buySignal1, style=shape.square, color=color.new(color.green, 10), size=size.tiny, location=location.belowbar, title="Buy Signal")
plotshape(sellSignal1, style=shape.square, color=color.new(color.red, 10), size=size.tiny, location=location.abovebar, title="Sell Signal")
plotshape(buySignal1, style=shape.square, color=color.new(color.green, 90), size=size.small, location=location.belowbar, title="Buy Signal")
plotshape(sellSignal1, style=shape.square, color=color.new(color.red, 90), size=size.small, location=location.abovebar, title="Sell Signal")