
Ý tưởng cốt lõi của chiến lược này là kết hợp 123 chiến lược đảo ngược và chỉ số dao động cầu vồng để thực hiện theo dõi xu hướng kép để tăng tỷ lệ chiến lược. Chiến lược này theo dõi xu hướng giá ngắn hạn và trung hạn, điều chỉnh vị trí một cách động, để đạt được lợi nhuận vượt quá thị trường lớn.
Chiến lược này bao gồm hai phần:
123 Chiến lược đảo ngược: Nếu giá đóng cửa giảm hai ngày trước và giá đóng cửa tăng lên hôm nay và đường K chậm dưới 50 vào ngày 9, hãy làm nhiều; Nếu giá đóng cửa tăng hai ngày trước và giá đóng cửa giảm xuống hôm nay và đường K nhanh trên 50 vào ngày 9, hãy làm trống.
Chỉ số dao động cầu vồng: Chỉ số này phản ánh mức độ lệch của giá so với trung bình di chuyển, khi chỉ số cao hơn 80, nó cho thấy thị trường có xu hướng không ổn định; khi chỉ số thấp hơn 20, nó cho thấy thị trường có xu hướng đảo ngược.
Chiến lược này kết hợp cả hai, đồng thời mở vị trí khi có tín hiệu giảm giá nhiều hơn, nếu không thì giảm vị trí.
Chiến lược này có những ưu điểm sau:
Chiến lược này cũng có những rủi ro sau:
Những rủi ro này có thể được giảm thiểu bằng cách điều chỉnh các tham số, tối ưu hóa quản lý vị trí và thiết lập lệnh dừng lỗ hợp lý.
Chiến lược này có thể được tối ưu hóa bằng cách:
Chiến lược này tích hợp 123 chiến lược đảo ngược và chỉ số dao động cầu vồng, thực hiện theo dõi xu hướng kép, trong khi vẫn giữ được sự ổn định cao, có một số lợi nhuận dư thừa. Bằng cách tối ưu hóa liên tục, có khả năng nâng cao hơn nữa lợi nhuận của chiến lược.
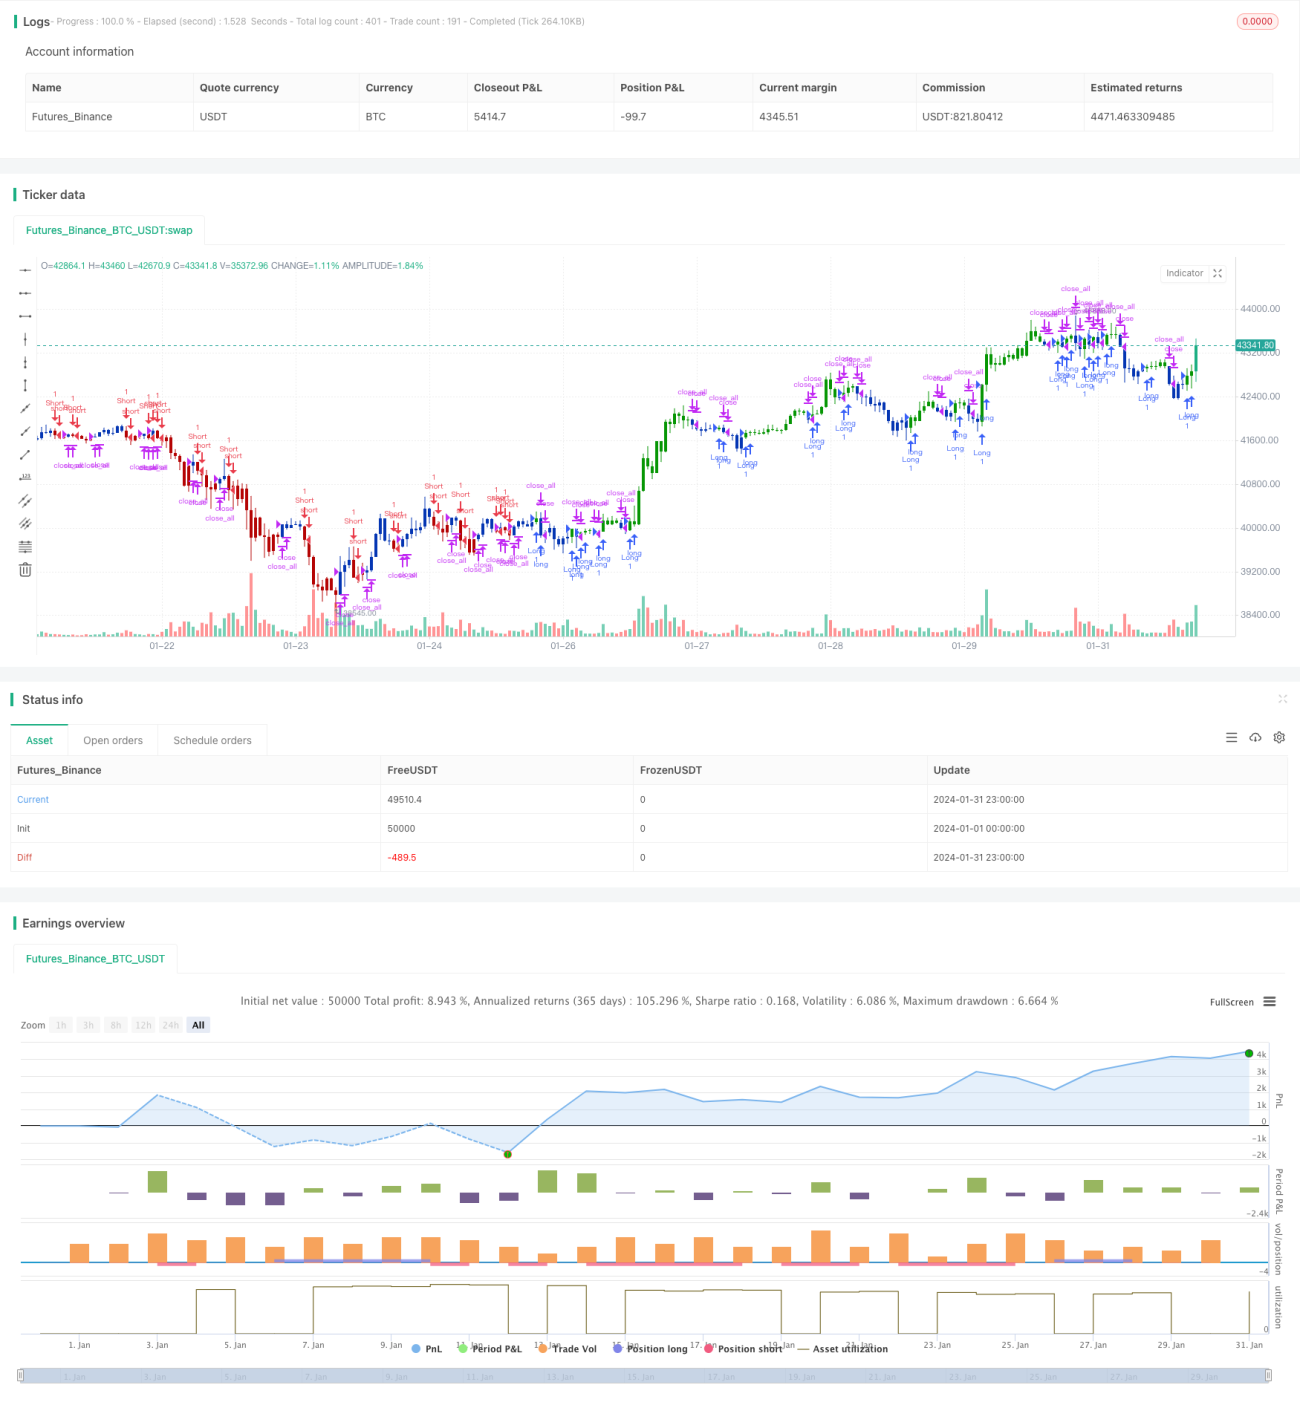
/*backtest
start: 2024-01-01 00:00:00
end: 2024-01-31 23:59:59
period: 1h
basePeriod: 15m
exchanges: [{"eid":"Futures_Binance","currency":"BTC_USDT"}]
*/
//@version=4
////////////////////////////////////////////////////////////
// Copyright by HPotter v1.0 25/05/2021
// This is combo strategies for get a cumulative signal.
//
// First strategy
// This System was created from the Book "How I Tripled My Money In The
// Futures Market" by Ulf Jensen, Page 183. This is reverse type of strategies.
// The strategy buys at market, if close price is higher than the previous close
// during 2 days and the meaning of 9-days Stochastic Slow Oscillator is lower than 50.
// The strategy sells at market, if close price is lower than the previous close price
// during 2 days and the meaning of 9-days Stochastic Fast Oscillator is higher than 50.
//
// Second strategy
// Ever since the people concluded that stock market price movements are not
// random or chaotic, but follow specific trends that can be forecasted, they
// tried to develop different tools or procedures that could help them identify
// those trends. And one of those financial indicators is the Rainbow Oscillator
// Indicator. The Rainbow Oscillator Indicator is relatively new, originally
// introduced in 1997, and it is used to forecast the changes of trend direction.
// As market prices go up and down, the oscillator appears as a direction of the
// trend, but also as the safety of the market and the depth of that trend. As
// the rainbow grows in width, the current trend gives signs of continuity, and
// if the value of the oscillator goes beyond 80, the market becomes more and more
// unstable, being prone to a sudden reversal. When prices move towards the rainbow
// and the oscillator becomes more and more flat, the market tends to remain more
// stable and the bandwidth decreases. Still, if the oscillator value goes below 20,
// the market is again, prone to sudden reversals. The safest bandwidth value where
// the market is stable is between 20 and 80, in the Rainbow Oscillator indicator value.
// The depth a certain price has on a chart and into the rainbow can be used to judge
// the strength of the move.
//
// WARNING:
// - For purpose educate only
// - This script to change bars colors.
////////////////////////////////////////////////////////////
Reversal123(Length, KSmoothing, DLength, Level) =>
vFast = sma(stoch(close, high, low, Length), KSmoothing)
vSlow = sma(vFast, DLength)
pos = 0.0
pos := iff(close[2] < close[1] and close > close[1] and vFast < vSlow and vFast > Level, 1,
iff(close[2] > close[1] and close < close[1] and vFast > vSlow and vFast < Level, -1, nz(pos[1], 0)))
pos
RO(Length, LengthHHLL) =>
pos = 0.0
xMA1 = sma(close, Length)
xMA2 = sma(xMA1, Length)
xMA3 = sma(xMA2, Length)
xMA4 = sma(xMA3, Length)
xMA5 = sma(xMA4, Length)
xMA6 = sma(xMA5, Length)
xMA7 = sma(xMA6, Length)
xMA8 = sma(xMA7, Length)
xMA9 = sma(xMA8, Length)
xMA10 = sma(xMA9, Length)
xHH = highest(close, LengthHHLL)
xLL = lowest(close, LengthHHLL)
xHHMAs = max(xMA1,max(xMA2,max(xMA3,max(xMA4,max(xMA5,max(xMA6,max(xMA7,max(xMA8,max(xMA9,xMA10)))))))))
xLLMAs = min(xMA1,min(xMA2,min(xMA3,min(xMA4,min(xMA5,min(xMA6,min(xMA7,min(xMA8,min(xMA9,xMA10)))))))))
xRBO = 100 * ((close - ((xMA1+xMA2+xMA3+xMA4+xMA5+xMA6+xMA7+xMA8+xMA9+xMA10) / 10)) / (xHH - xLL))
xRB = 100 * ((xHHMAs - xLLMAs) / (xHH - xLL))
pos:= iff(xRBO > 0, 1,
iff(xRBO < 0, -1, nz(pos[1], 0)))
pos
strategy(title="Combo Backtest 123 Reversal & Rainbow Oscillator", shorttitle="Combo", overlay = true)
line1 = input(true, "---- 123 Reversal ----")
Length = input(14, minval=1)
KSmoothing = input(1, minval=1)
DLength = input(3, minval=1)
Level = input(50, minval=1)
//-------------------------
line2 = input(true, "---- Rainbow Oscillator ----")
LengthRO = input(2, minval=1)
LengthHHLL = input(10, minval=2, title="HHV/LLV Lookback")
reverse = input(false, title="Trade reverse")
posReversal123 = Reversal123(Length, KSmoothing, DLength, Level)
posRO = RO(LengthRO, LengthHHLL)
pos = iff(posReversal123 == 1 and posRO == 1 , 1,
iff(posReversal123 == -1 and posRO == -1, -1, 0))
possig = iff(reverse and pos == 1, -1,
iff(reverse and pos == -1 , 1, pos))
if (possig == 1 )
strategy.entry("Long", strategy.long)
if (possig == -1 )
strategy.entry("Short", strategy.short)
if (possig == 0)
strategy.close_all()
barcolor(possig == -1 ? #b50404: possig == 1 ? #079605 : #0536b3 )