
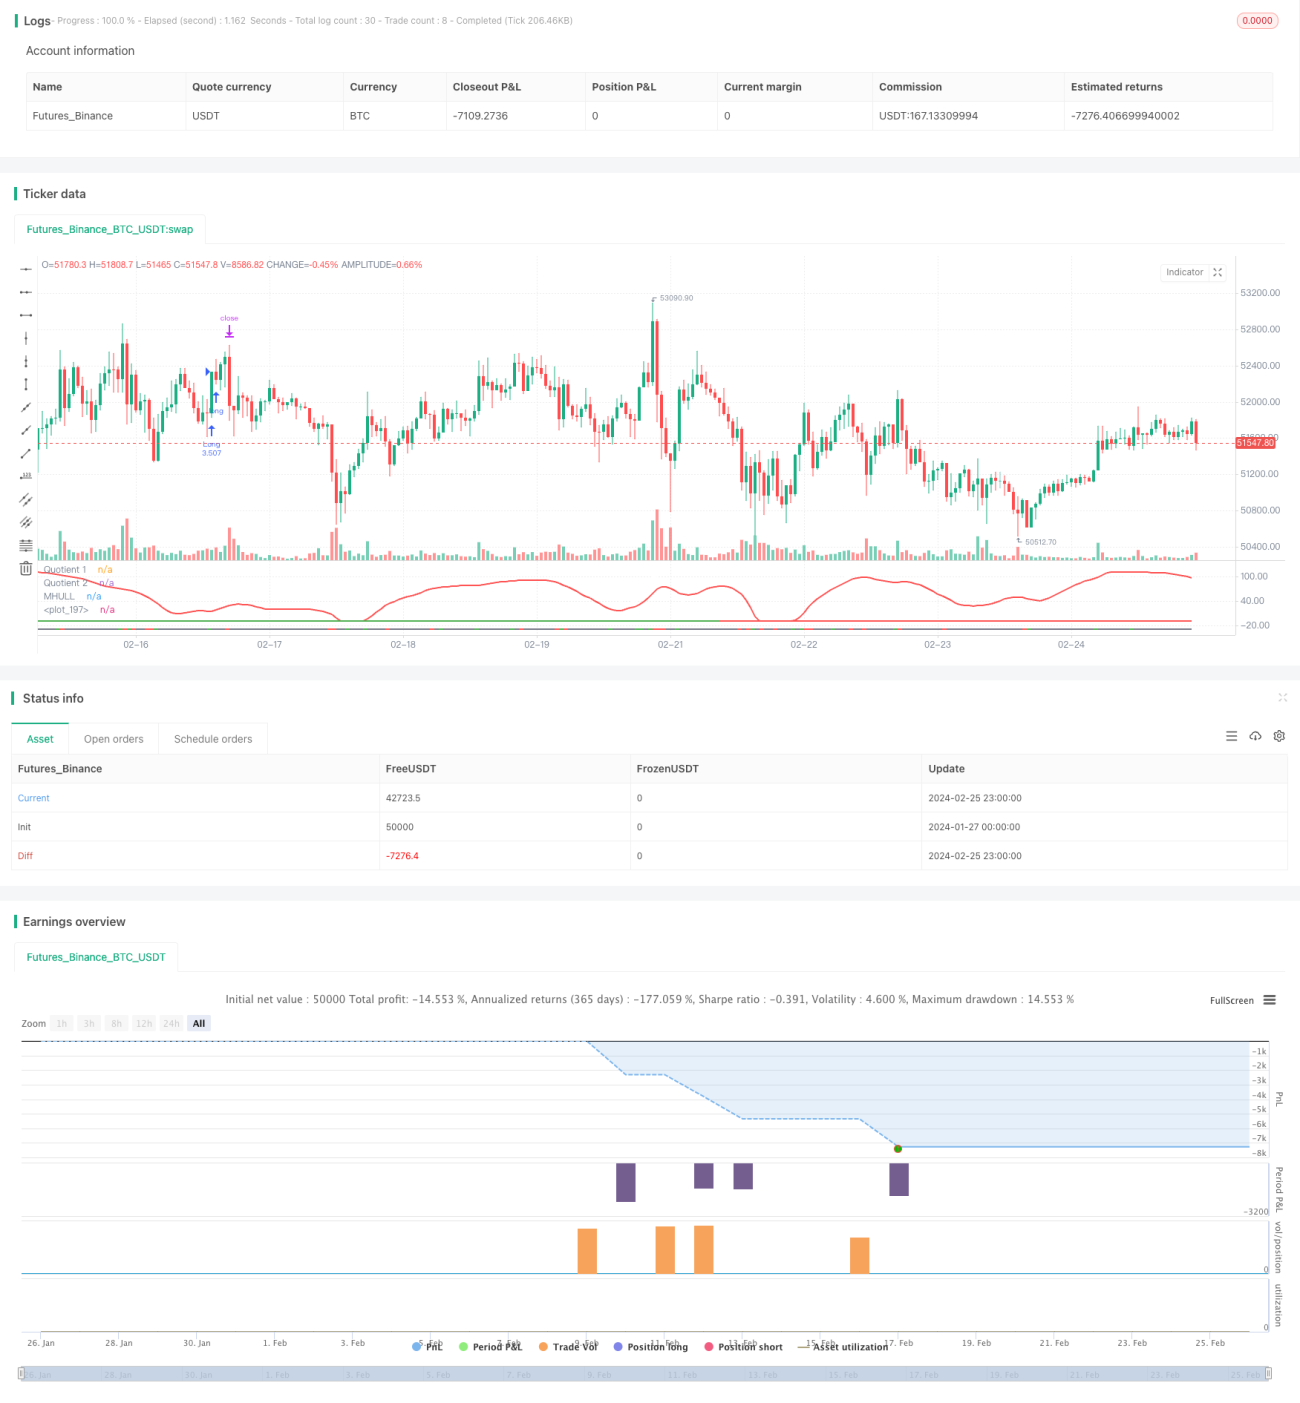
Chiến lược này thực hiện chiến lược định lượng theo dõi xu hướng và phá vỡ giao dịch trong nhiều khung thời gian bằng cách kết hợp ba chỉ số Boom Hunter, Hull Suite và Volatility Oscillator. Chiến lược này áp dụng cho các tài sản kỹ thuật số có biến động cao và tình huống giá đột ngột như Bitcoin.
Lập luận cốt lõi của chiến lược này dựa trên ba chỉ số sau:
Boom Hunter (Người thợ săn vải): Một bộ dao động sử dụng công nghệ nén chỉ số để đánh giá tín hiệu mua và bán thông qua sự giao thoa của hai chỉ số (Quotient1 và Quotient2).
Bộ Hull Suite: Một bộ chỉ số đường trung bình di chuyển trơn để đánh giá hướng xu hướng thông qua mối quan hệ giữa đường trục và đường trục trên và dưới
Động cơ dao động biến độngMột chỉ số dao động thông tin về biến động giá cả định lượng.
Logic nhập cảnh của chiến lược này là, khi hai chỉ số Quotient của người săn lùng lụa xảy ra trên hoặc xuống, giá sẽ phá vỡ đường trung tâm của Hull và lệch khỏi đường trên hoặc đường dưới, trong khi đó chỉ số dao động nằm trong khu vực mua quá mức. Điều này có thể lọc ra một số tín hiệu phá vỡ giả để cải thiện độ chính xác của nhập cảnh.
Hạn lỗ được thiết lập bằng cách tìm kiếm một hốc thấp nhất hoặc đỉnh cao nhất trong một chu kỳ nhất định (đặc biệt là 20 đường K), và lợi nhuận được tính bằng tỷ lệ dừng lỗ nhân tỷ lệ dừng của cấu hình (đặc biệt là 3 lần). Vị trí được tính dựa trên tỷ lệ tổng tài sản trên tài khoản (đặc biệt là 3%) và tỷ lệ dừng lỗ của một chỉ số cụ thể.
Giải pháp:
Chiến lược này có thể được tối ưu hóa theo các khía cạnh sau:
Tối ưu hóa tham số: Nhận được sự kết hợp tốt nhất bằng cách thay đổi các tham số chỉ số như độ dài chu kỳ, hệ số nén, v.v.
Tối ưu hóa khung thời gianThử nghiệm các chu kỳ thời gian khác nhau (như 1 phút, 5 phút, 30 phút, v.v.), tìm chu kỳ giao dịch phù hợp nhất
Tối ưu hóa vị tríThay đổi kích thước và tỷ lệ vị trí của mỗi giao dịch để tìm cách sử dụng vốn tối ưu
Tối ưu hóa Stop Loss: Điều chỉnh vị trí dừng lỗ cho các cặp giao dịch khác nhau để đạt được tỷ lệ lợi nhuận rủi ro tối ưu
Điều kiện tối ưu hóa: Tăng hoặc giảm các điều kiện lọc chỉ số để có thời gian nhập cảnh chính xác hơn
Chiến lược này có thể kiểm soát rủi ro, tối ưu hóa nhiều khía cạnh thông qua các tham số, điều kiện đợt sóng và dừng lỗ, có tính thực tế và khả năng mở rộng mạnh mẽ.
/*backtest
start: 2024-01-27 00:00:00
end: 2024-02-26 00:00:00
period: 1h
basePeriod: 15m
exchanges: [{"eid":"Futures_Binance","currency":"BTC_USDT"}]
*/
// Strategy based on the 3 indicators:
// - Boom Hunter Pro
// - Hull Suite
// - Volatility Oscillator
//
// Strategy was designed for the purpose of back testing.
// See strategy documentation for info on trade entry logic.
//
// Credits:
// - Boom Hunter Pro: veryfid (https://www.tradingview.com/u/veryfid/)
// - Hull Suite: InSilico (https://www.tradingview.com/u/InSilico/)
// - Volatility Oscillator: veryfid (https://www.tradingview.com/u/veryfid/)
//@version=5
strategy("Boom Hunter + Hull Suite + Volatility Oscillator Strategy", overlay=false, initial_capital=1000, currency=currency.NONE, max_labels_count=500, default_qty_type=strategy.cash, commission_type=strategy.commission.percent, commission_value=0.01)
// =============================================================================
// STRATEGY INPUT SETTINGS
// =============================================================================
// ---------------
// Risk Management
// ---------------
swingLength = input.int(20, "Swing High/Low Lookback Length", group='Strategy: Risk Management', tooltip='Stop Loss is calculated by the swing high or low over the previous X candles')
accountRiskPercent = input.float(3, "Account percent loss per trade", step=0.1, group='Strategy: Risk Management', tooltip='Each trade will risk X% of the account balance')
profitFactor = input.float(3, "Profit Factor (R:R Ratio)", step = 0.1, group='Strategy: Risk Management')
// ----------
// Date Range
// ----------
start_year = input.int(title='Start Date', defval=2022, minval=2010, maxval=3000, group='Strategy: Date Range', inline='1')
start_month = input.int(title='', defval=1, group='Strategy: Date Range', inline='1', options = [1, 2, 3, 4, 5, 6, 7, 8, 9, 10, 11, 12])
start_date = input.int(title='', defval=1, group='Strategy: Date Range', inline='1', options = [1, 2, 3, 4, 5, 6, 7, 8, 9, 10, 11, 12, 13, 14, 15, 16, 17, 18, 19, 20, 21, 22, 23, 24, 25, 26, 27, 28, 29, 30, 31])
end_year = input.int(title='End Date', defval=2023, minval=1800, maxval=3000, group='Strategy: Date Range', inline='2')
end_month = input.int(title='', defval=1, group='Strategy: Date Range', inline='2', options = [1, 2, 3, 4, 5, 6, 7, 8, 9, 10, 11, 12])
end_date = input.int(title='', defval=1, group='Strategy: Date Range', inline='2', options = [1, 2, 3, 4, 5, 6, 7, 8, 9, 10, 11, 12, 13, 14, 15, 16, 17, 18, 19, 20, 21, 22, 23, 24, 25, 26, 27, 28, 29, 30, 31])
in_date_range = true
// =============================================================================
// INDICATORS
// =============================================================================
// ---------------
// Boom Hunter Pro
// ---------------
square = input.bool(true, title='Square Line?', group='Main Settings')
//Quotient
LPPeriod = input.int(6, title='Quotient | LPPeriod', inline='quotient', group='EOT 1 (Main Oscillator)')
K1 = input.int(0, title='K1', inline='quotient', group='EOT 1 (Main Oscillator)')
esize = 60 //, title = "Size", inline = "quotient2", group = "EOT 1 (Main Oscillator)")
ey = 50 //, title = "Y axis", inline = "quotient2", group = "EOT 1 (Main Oscillator)")
trigno = input.int(1, 'Trigger Length', group='EOT 1 (Main Oscillator)', inline='quotient2')
trigcol = input.color(color.white, title='Trigger Color:', group='EOT 1 (Main Oscillator)', inline='q2')
// EOT 2
//Inputs
LPPeriod2 = input.int(28, title='LPPeriod2', group='EOT 2 (Red Wave)', inline='q2')
K22 = input.float(0.3, title='K2', group='EOT 2 (Red Wave)', inline='q2')
//EOT 1
//Vars
alpha1 = 0.00
HP = 0.00
a1 = 0.00
b1 = 0.00
c1 = 0.00
c2 = 0.00
c3 = 0.00
Filt = 0.00
Peak = 0.00
X = 0.00
Quotient1 = 0.00
pi = 2 * math.asin(1)
//Highpass filter cyclic components
//whose periods are shorter than 100 bars
alpha1 := (math.cos(.707 * 2 * pi / 100) + math.sin(.707 * 2 * pi / 100) - 1) / math.cos(.707 * 2 * pi / 100)
HP := (1 - alpha1 / 2) * (1 - alpha1 / 2) * (close - 2 * nz(close[1]) + nz(close[2])) + 2 * (1 - alpha1) * nz(HP[1]) - (1 - alpha1) * (1 - alpha1) * nz(HP[2])
//SuperSmoother Filter
a1 := math.exp(-1.414 * pi / LPPeriod)
b1 := 2 * a1 * math.cos(1.414 * pi / LPPeriod)
c2 := b1
c3 := -a1 * a1
c1 := 1 - c2 - c3
Filt := c1 * (HP + nz(HP[1])) / 2 + c2 * nz(Filt[1]) + c3 * nz(Filt[2])
//Fast Attack - Slow Decay Algorithm
Peak := .991 * nz(Peak[1])
if math.abs(Filt) > Peak
Peak := math.abs(Filt)
Peak
//Normalized Roofing Filter
if Peak != 0
X := Filt / Peak
X
Quotient1 := (X + K1) / (K1 * X + 1)
// EOT 2
//Vars
alpha1222 = 0.00
HP2 = 0.00
a12 = 0.00
b12 = 0.00
c12 = 0.00
c22 = 0.00
c32 = 0.00
Filt2 = 0.00
Peak2 = 0.00
X2 = 0.00
Quotient4 = 0.00
alpha1222 := (math.cos(.707 * 2 * pi / 100) + math.sin(.707 * 2 * pi / 100) - 1) / math.cos(.707 * 2 * pi / 100)
HP2 := (1 - alpha1222 / 2) * (1 - alpha1222 / 2) * (close - 2 * nz(close[1]) + nz(close[2])) + 2 * (1 - alpha1222) * nz(HP2[1]) - (1 - alpha1222) * (1 - alpha1222) * nz(HP2[2])
//SuperSmoother Filter
a12 := math.exp(-1.414 * pi / LPPeriod2)
b12 := 2 * a12 * math.cos(1.414 * pi / LPPeriod2)
c22 := b12
c32 := -a12 * a12
c12 := 1 - c22 - c32
Filt2 := c12 * (HP2 + nz(HP2[1])) / 2 + c22 * nz(Filt2[1]) + c32 * nz(Filt2[2])
//Fast Attack - Slow Decay Algorithm
Peak2 := .991 * nz(Peak2[1])
if math.abs(Filt2) > Peak2
Peak2 := math.abs(Filt2)
Peak2
//Normalized Roofing Filter
if Peak2 != 0
X2 := Filt2 / Peak2
X2
Quotient4 := (X2 + K22) / (K22 * X2 + 1)
q4 = Quotient4 * esize + ey
//Plot EOT
q1 = Quotient1 * esize + ey
trigger = ta.sma(q1, trigno)
Plot3 = plot(trigger, color=trigcol, linewidth=2, title='Quotient 1')
Plot44 = plot(q4, color=color.new(color.red, 0), linewidth=2, title='Quotient 2')
// ----------
// HULL SUITE
// ----------
//INPUT
src = input(close, title='Source')
modeSwitch = input.string('Hma', title='Hull Variation', options=['Hma', 'Thma', 'Ehma'])
length = input(200, title='Length(180-200 for floating S/R , 55 for swing entry)')
lengthMult = input(2.4, title='Length multiplier (Used to view higher timeframes with straight band)')
useHtf = input(false, title='Show Hull MA from X timeframe? (good for scalping)')
htf = input.timeframe('240', title='Higher timeframe')
//FUNCTIONS
//HMA
HMA(_src, _length) =>
ta.wma(2 * ta.wma(_src, _length / 2) - ta.wma(_src, _length), math.round(math.sqrt(_length)))
//EHMA
EHMA(_src, _length) =>
ta.ema(2 * ta.ema(_src, _length / 2) - ta.ema(_src, _length), math.round(math.sqrt(_length)))
//THMA
THMA(_src, _length) =>
ta.wma(ta.wma(_src, _length / 3) * 3 - ta.wma(_src, _length / 2) - ta.wma(_src, _length), _length)
//SWITCH
Mode(modeSwitch, src, len) =>
modeSwitch == 'Hma' ? HMA(src, len) : modeSwitch == 'Ehma' ? EHMA(src, len) : modeSwitch == 'Thma' ? THMA(src, len / 2) : na
//OUT
_hull = Mode(modeSwitch, src, int(length * lengthMult))
HULL = useHtf ? request.security(syminfo.ticker, htf, _hull) : _hull
MHULL = HULL[0]
SHULL = HULL[2]
//COLOR
hullColor = MHULL > SHULL ? color.green : color.red
//PLOT
///< Frame
Fi1 = plot(-10, title='MHULL', color=hullColor, linewidth=2)
// -----------------
// VOLUME OSCILLATOR
// -----------------
volLength = input(80)
spike = close - open
x = ta.stdev(spike, volLength)
y = ta.stdev(spike, volLength) * -1
volOscCol = spike > x ? color.green : spike < y ? color.red : color.gray
plot(-30, color=color.new(volOscCol, transp=0), linewidth=2)
// =============================================================================
// STRATEGY LOGIC
// =============================================================================
// Boom Hunter Pro entry conditions
boomLong = ta.crossover(trigger, q4)
boomShort = ta.crossunder(trigger, q4)
// Hull Suite entry conditions
hullLong = MHULL > SHULL and close > MHULL
hullShort = MHULL < SHULL and close < SHULL
// Volatility Oscillator entry conditions
volLong = spike > x
volShort = spike < y
inLong = strategy.position_size > 0
inShort = strategy.position_size < 0
longCondition = boomLong and hullLong and volLong and in_date_range
shortCondition = boomShort and hullShort and volShort and in_date_range
swingLow = ta.lowest(source=low, length=swingLength)
swingHigh = ta.highest(source=high, length=swingLength)
atr = ta.atr(14)
longSl = math.min(close - atr, swingLow)
shortSl = math.max(close + atr, swingHigh)
longStopPercent = math.abs((1 - (longSl / close)) * 100)
shortStopPercent = math.abs((1 - (shortSl / close)) * 100)
longTpPercent = longStopPercent * profitFactor
shortTpPercent = shortStopPercent * profitFactor
longTp = close + (close * (longTpPercent / 100))
shortTp = close - (close * (shortTpPercent / 100))
// Position sizing (default risk 3% per trade)
riskAmt = strategy.equity * accountRiskPercent / 100
longQty = math.abs(riskAmt / longStopPercent * 100) / close
shortQty = math.abs(riskAmt / shortStopPercent * 100) / close
if (longCondition and not inLong)
strategy.entry("Long", strategy.long, qty=longQty)
strategy.exit("Long SL/TP", from_entry="Long", stop=longSl, limit=longTp, alert_message='Long SL Hit')
buyLabel = label.new(x=bar_index, y=high[1], color=color.green, style=label.style_label_up)
label.set_y(id=buyLabel, y=-40)
label.set_tooltip(id=buyLabel, tooltip="Risk Amt: " + str.tostring(riskAmt) + " Qty: " + str.tostring(longQty) + " Swing low: " + str.tostring(swingLow) + " Stop Percent: " + str.tostring(longStopPercent) + " TP Percent: " + str.tostring(longTpPercent))
if (shortCondition and not inShort)
strategy.entry("Short", strategy.short, qty=shortQty)
strategy.exit("Short SL/TP", from_entry="Short", stop=shortSl, limit=shortTp, alert_message='Short SL Hit')
sellLabel = label.new(x=bar_index, y=high[1], color=color.red, style=label.style_label_up)
label.set_y(id=sellLabel, y=-40)
label.set_tooltip(id=sellLabel, tooltip="Risk Amt: " + str.tostring(riskAmt) + " Qty: " + str.tostring(shortQty) + " Swing high: " + str.tostring(swingHigh) + " Stop Percent: " + str.tostring(shortStopPercent) + " TP Percent: " + str.tostring(shortTpPercent))