Chiến lược giao dịch RSI swing dựa trên điều chỉnh trong năm

1
Follow
1782
Followers
Tổng quan
Chiến lược này là một chiến lược giao dịch dao động RSI dựa trên điều chỉnh trong năm, bằng cách theo dõi các đặc điểm dao động của chỉ số RSI giữa các đường đi lên và xuống được thiết lập, để phát ra tín hiệu giao dịch khi chỉ số RSI chạm vào đường đi xuống.
Nguyên tắc chiến lược
- Thiết lập chiều dài đường trung bình MA, tham số RSI, đường đua lên xuống, tham số dừng lỗ, phạm vi chu kỳ giao dịch
- Tính toán RSI, RSI = ((trung bình tăng) / ((trung bình tăng + trung bình giảm)*100
- Hình vẽ chỉ số RSI và đường đi
- Chỉ số RSI trên đi xuống đường ray là nhiều tín hiệu, dưới đi xuống đường ray là tín hiệu trống
- Tạo danh sách OCO
- Hạn chế và dừng theo logic dừng lỗ theo cài đặt
Phân tích lợi thế chiến lược
- Một số môi trường bên ngoài không phù hợp có thể được tránh bằng cách thiết lập chu kỳ giao dịch trong năm.
- Chỉ số RSI có thể phản ánh hiệu quả tình trạng quá mua quá bán và có thể lọc một phần tiếng ồn bằng cách đặt các giao dịch xung đột trong một khoảng thời gian hợp lý.
- OCO được kết hợp với thiết lập dừng lỗ, có thể kiểm soát rủi ro hiệu quả.
Phân tích rủi ro chiến lược
- RSI không đảm bảo tính chính xác của phán đoán quan trọng, có thể có một số rủi ro sai lầm.
- Việc thiết lập không đúng chu kỳ giao dịch trong năm có thể làm bạn bỏ lỡ cơ hội giao dịch tốt hơn hoặc vào môi trường giao dịch không phù hợp.
- Đặt điểm dừng quá lớn có thể gây ra tổn thất lớn, đặt điểm dừng quá nhỏ có thể gây ra lợi nhuận quá nhỏ.
Có thể tối ưu hóa bằng cách điều chỉnh các tham số RSI, phạm vi thời gian chu kỳ giao dịch, tỷ lệ dừng lỗ.
Hướng tối ưu hóa chiến lược
- Kiểm tra các giá trị tối ưu của các tham số RSI trong các chu kỳ khác nhau của các thị trường khác nhau
- Phân tích quy luật chu kỳ của thị trường tổng thể để thiết lập thời gian giao dịch tốt nhất trong năm
- Xác định tỷ lệ dừng lỗ hợp lý bằng cách đo đạc lại
- Tối ưu hóa lựa chọn loại giao dịch và tăng quy mô nắm giữ
- Tối ưu hóa kết hợp với các kỹ thuật hoặc chỉ số giao dịch tốt hơn khác
Tóm tắt
Chiến lược này theo dõi xu hướng giao dịch thông qua các dấu hiệu dao động của chỉ số RSI trong một chu kỳ nhất định trong năm, kiểm soát rủi ro giao dịch hiệu quả. Hiệu quả chiến lược cao hơn có thể đạt được bằng cách tối ưu hóa tham số và tối ưu hóa quy tắc.
Source
Pine
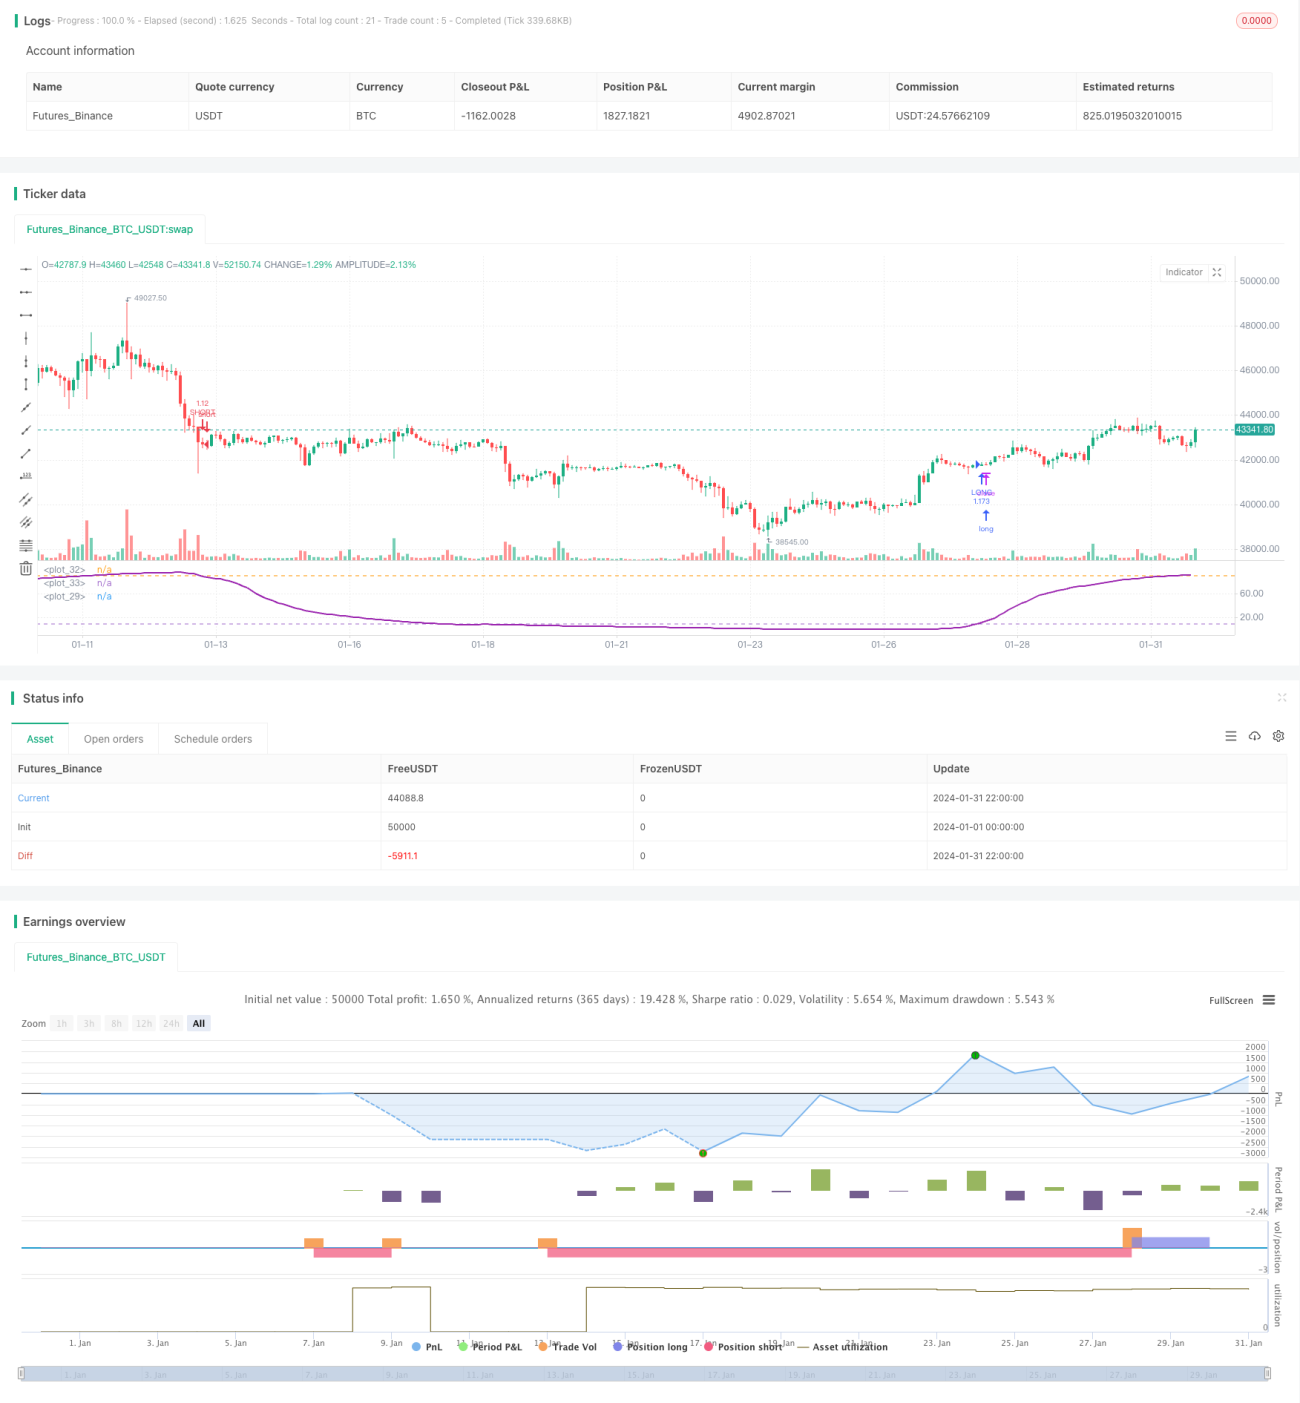
/*backtest
start: 2024-01-01 00:00:00
end: 2024-01-31 23:59:59
period: 2h
basePeriod: 15m
exchanges: [{"eid":"Futures_Binance","currency":"BTC_USDT"}]
*/

//@version=3
strategy(title = "Bitlinc MARSI Study AST",shorttitle="Bitlinc MARSI Study AST",default_qty_type = strategy.percent_of_equity, default_qty_value = 100,commission_type=strategy.commission.percent,commission_value=0.1,initial_capital=1000,currency="USD",pyramiding=0, calc_on_order_fills=false)

// === General Inputs ===Strategy parameters
Related strategies
Comment
All comments (0)
No data
- 1