Chiến lược theo xu hướng khung thời gian đa dạng dựa trên các chỉ báo hỗ trợ, kháng cự và động lượng
Tổng quan về chiến lược
Chiến lược tổng hợp sử dụng nhiều chỉ số kỹ thuật như mức kháng cự hỗ trợ, chỉ số xu hướng siêu và đường trung bình di chuyển để đánh giá hướng xu hướng tổng hợp trên nhiều khung thời gian, để thực hiện một hệ thống giao dịch theo dõi xu hướng. Ý tưởng chính của chiến lược này là: Đầu tiên, sử dụng các điểm trung tâm để đánh giá vị trí kháng cự hỗ trợ ở mức giá hiện tại, sau đó sử dụng chỉ số xu hướng siêu để đánh giá hướng xu hướng hiện tại, và cuối cùng là lọc đường trung bình di chuyển khỏi tình trạng.
Nguyên tắc chiến lược
- Đầu tiên, tính điểm trung tâm dựa trên giá cao nhất hoặc thấp nhất trong một chu kỳ nhất định trước đó, để có được mức kháng cự hỗ trợ cho giá hiện tại.
- Sử dụng chỉ số Supertrend để đánh giá xu hướng. Siêu xu hướng được tính toán bằng kháng cự hỗ trợ động, là một chỉ số theo dõi xu hướng.
- Sử dụng ATR Stop. Chiến lược này đã thêm ATR vào vị trí dừng lỗ trên cơ sở xu hướng siêu nguyên thủy.
- Sử dụng đường trung bình di chuyển làm bộ lọc xu hướng. Chỉ làm nhiều khi xu hướng lên và giá trên đường trung bình, xu hướng xuống và giá dưới đường trung bình.
- Thiết lập cửa sổ thời gian giao dịch. Chỉ mở vị trí trong một khoảng thời gian nhất định, tránh giao dịch tại các thời điểm quan trọng.
- Nhiều vị trí trống được quản lý riêng biệt. Các tín hiệu đa đầu và trống sẽ kích hoạt các logic mở lỗ tương ứng.
Tóm lại, chiến lược này mở vị trí khi ba điều kiện cộng hưởng với điểm trung tâm hỗ trợ kháng cự, hướng siêu xu hướng và hướng đồng tuyến, bất kỳ điều kiện nào không có hiệu lực là bằng phẳng. Điều này có hiệu quả trong việc nắm bắt xu hướng, đồng thời kiểm soát rủi ro.
Phân tích lợi thế
- Lợi thế của giao dịch dựa trên hỗ trợ điểm kháng cự là phù hợp với luật cung cầu của thị trường, điểm trung tâm có thể phản ứng động với sự cân bằng của thị trường.
- Siêu xu hướng có thể nắm bắt xu hướng một cách hiệu quả và dừng lại kịp thời.
- Bộ lọc đường trung bình tránh giao dịch ngược. Khi nhập cuộc khi xu hướng và đường trung bình cộng hưởng, tỷ lệ chiến thắng sẽ cao hơn.
- Cửa sổ thời gian giao dịch tùy chỉnh có thể tránh giao dịch ở các thời điểm quan trọng như trước khi mở và đóng cửa.
- Các tín hiệu đa đầu và đầu trống hoạt động độc lập, đồng thời có thể giữ nhiều vị trí trống, tận dụng đầy đủ hơn cơ hội thị trường.
Phân tích rủi ro
- Rủi ro của giao dịch thường xuyên. Chiến lược này có thể gây ra chi phí giao dịch quá mức khi thường xuyên tháo lỗ trong thị trường chấn động.
- Mặc dù chiến lược này đã sử dụng bộ lọc đường trung bình, nhưng nó vẫn có thể xảy ra nếu đường trung bình tự nó trái với xu hướng lớn.
- Vấn đề tối ưu hóa tham số. Chiến lược có nhiều tham số, chẳng hạn như chu kỳ và nhân của siêu xu hướng, chu kỳ trung bình. Các tham số khác nhau sẽ có kết quả khác nhau, cách chọn kết hợp tham số tối ưu là một thách thức.
- Chiến lược này có thể không hiệu quả trong các tình huống cực đoan. Trong các tình huống cực đoan, chẳng hạn như đợt sụt giảm mạnh, khủng hoảng thanh khoản, chiến lược này có thể không dừng lại kịp thời.
Hướng tối ưu hóa
- Tiếp theo, chúng ta sẽ đưa ra nhiều đường trung bình dài hạn hơn, tăng độ tin cậy trong việc đánh giá xu hướng và giảm giao dịch thường xuyên.
- Có thể xem xét việc giới thiệu các chỉ số biến động, chẳng hạn như BRI, để giảm giao dịch trong thị trường biến động cao.
- Tối ưu hóa các tham số, tìm ra sự kết hợp tham số tốt nhất, tăng sự ổn định của chiến lược.
- Thiết lập lỗ hổng cứng, kiểm soát rủi ro trong trường hợp cực đoan. Ngoài ra, bạn có thể xem xét việc đưa ra phán quyết về biến động bất thường của thị trường, chẳng hạn như giá tăng cao, khối lượng giao dịch tăng vọt, giảm hoặc ngừng giao dịch khi bất thường.
Tóm tắt
Chiến lược này tổng hợp nhiều phương pháp phân tích kỹ thuật như hỗ trợ kháng cự, theo dõi xu hướng, lọc động lực, có thể kiếm lợi nhuận hiệu quả trong xu hướng, đồng thời kiểm soát rủi ro rút lui. Ưu điểm của nó là tín hiệu rõ ràng, ngắn gọn, logic rõ ràng, phù hợp để sử dụng trong chu kỳ trung bình. Tuy nhiên, chiến lược này cũng có các vấn đề như giao dịch thường xuyên, khó tối ưu hóa tham số, không kiểm soát rủi ro trong điều kiện cực đoan.
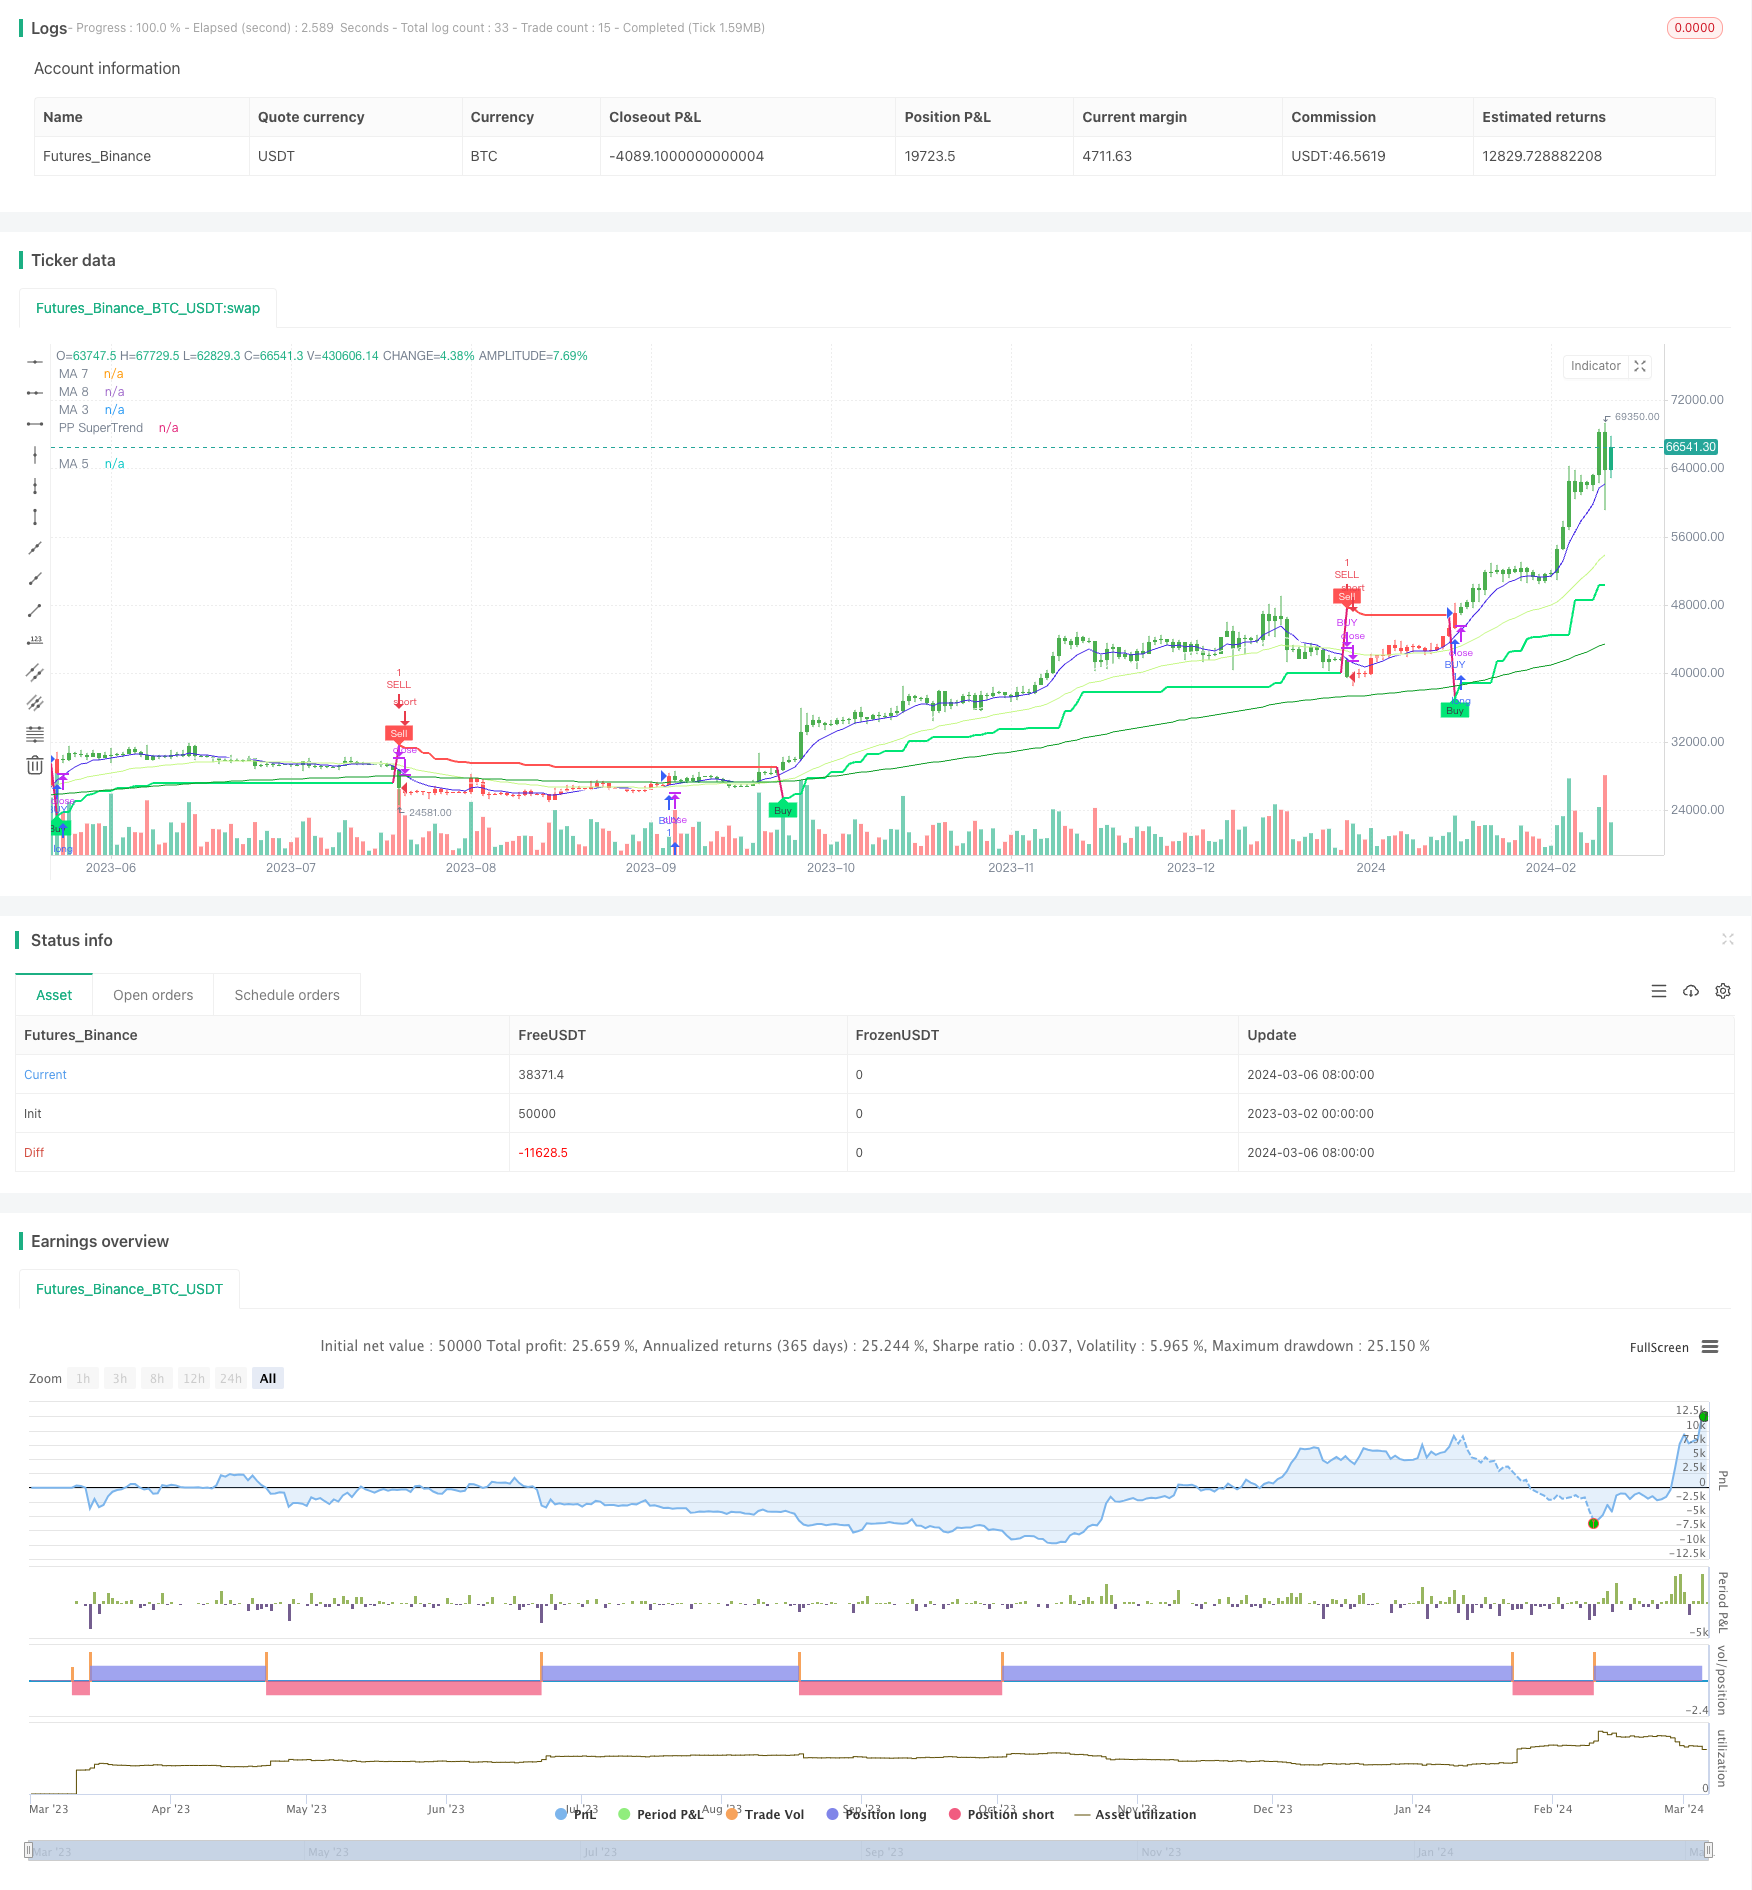
/*backtest
start: 2023-03-02 00:00:00
end: 2024-03-07 00:00:00
period: 1d
basePeriod: 1h
exchanges: [{"eid":"Futures_Binance","currency":"BTC_USDT"}]
*/

//@rpcoelho
// Based on © Julien_Eche "Pivot Point Supertrend" with optional EMAs ploted
//@version=4

strategy("PPS w/ EMAs", overlay=true)

prd = input(defval = 1, title="Pivot Point Period", minval = 1, maxval = 50)
Factor=input(defval = 4, title = "ATR Factor", minval = 1, step = 0.1)
Pd=input(defval = 72, title = "ATR Period", minval=1)
showpivot = input(defval = false, title="Show Pivot Points")
showlabel = input(defval = true, title="Show Buy/Sell Labels")
showcl = input(defval = false, title="Show PP Center Line")
showsr = input(defval = false, title="Show Support/Resistance")

/////////////////////////////////////////////////////////////////////////
// Switch Board
////////////////////////////////////////////////////////////////////////
// Define the switch board title as a label (since grouping is not available)
//switchboard_group = "████ Switch Board (Turn On/Off Overlay Indicators) ████"
//label.new(bar_index, high, switchboard_group, color=color.red)
// Create input controls for EMA and VWAP switches
switch_ema = input(true, title="EMA")

/////////////////////////////////////////////////////////////////////////
// EMA Selection
////////////////////////////////////////////////////////////////////////

ma_function(source, length, type) =>
    float ma = na
    if type == 'RMA'
        ma := rma(source, length)
    else if type == 'SMA'
        ma := sma(source, length)
    else if type == 'EMA'
        ma := ema(source, length)
    else if type == 'WMA'
        ma := wma(source, length)
    else if type == 'HMA'
        ma := length < 2 ? hma(source, 2) : hma(source, length)
    else
        ma := vwma(source, length)
    ma

// Moving Averages Line Title
//ma_group = "██████████ MAs Line ██████████"

// Inputs for MA 1
len1bool = input(false, title="Show MA 1")
len1 = input(13, title="Length MA 1")
ma_1_type = input("EMA", title="Type MA 1", options=["RMA", "SMA", "EMA", "WMA", "HMA", "VWMA"])
src_ma1 = input(title="MA1 Source", type=input.source, defval=close)
ma_1_colour = input(color.rgb(235, 159, 238), title="Color MA 1")

// Inputs for MA 2
len2bool = input(false, title="Show MA 2")
len2 = input(17, title="Length MA 2")
ma_2_type = input("EMA", title="Type MA 2", options=["RMA", "SMA", "EMA", "WMA", "HMA", "VWMA"])
src_ma2 = input(title="MA2 Source", type=input.source, defval=close)
ma_2_colour = input(color.rgb(230, 241, 65), title="Color MA 2")

// Inputs for MA 3
len3bool = input(true, title="Show MA 3")
len3 = input(34, title="Length MA 3")
ma_3_type = input("EMA", title="Type MA 3", options=["RMA", "SMA", "EMA", "WMA", "HMA", "VWMA"])
src_ma3 = input(title="MA3 Source", type=input.source, defval=close)
ma_3_colour = input(#c7f887, title="Color MA 3")

// Inputs for MA 4
len4bool = input(false, title="Show MA 4")
len4 = input(72, title="Length MA 4")
ma_4_type = input("EMA", title="Type MA 4", options=["RMA", "SMA", "EMA", "WMA", "HMA", "VWMA"])
src_ma4 = input(title="MA4 Source", type=input.source, defval=close)
ma_4_colour = input(#2f6999, title="Color MA 4")

// Inputs for MA 5
len5bool = input(true, title="Show MA 5")
len5 = input(144, title="Length MA 5")
ma_5_type = input("EMA", title="Type MA 5", options=["RMA", "SMA", "EMA", "WMA", "HMA", "VWMA"])
src_ma5 = input(title="MA5 Source", type=input.source, defval=close)
ma_5_colour = input(color.rgb(13, 156, 37), title="Color MA 5")

// Inputs for MA 6
len6bool = input(true, title="Show MA 6")
len6 = input(610, title="Length MA 6")
ma_6_type = input("EMA", title="Type MA 6", options=["RMA", "SMA", "EMA", "WMA", "HMA", "VWMA"])
src_ma6 = input(title="MA6 Source", type=input.source, defval=close)
ma_6_colour = input(color.rgb(173, 161, 152), title="Color MA 6")

// Inputs for MA 7
len7bool = input(true, title="Show MA 7")
len7 = input(8, title="Length MA 7")
ma_7_type = input("EMA", title="Type MA 7", options=["RMA", "SMA", "EMA", "WMA", "HMA", "VWMA"])
src_ma7 = input(title="MA7 Source", type=input.source, defval=close)
ma_7_colour = input(color.rgb(68, 39, 231), title="Color MA 7")

// Inputs for MA 8
len8bool = input(true, title="Show MA 8")
len8 = input(21, title="Length MA 8")
ma_8_type = input("EMA", title="Type MA 8", options=["RMA", "SMA", "EMA", "WMA", "HMA", "VWMA"])
src_ma8 = input(title="MA8 Source", type=input.source, defval=close)
ma_8_colour = input(color.white, title="Color MA 8")

ema1 = security(syminfo.tickerid, timeframe.period, ma_function(src_ma1, len1, ma_1_type))
ema2 = security(syminfo.tickerid, timeframe.period, ma_function(src_ma2, len2, ma_2_type))
ema3 = security(syminfo.tickerid, timeframe.period, ma_function(src_ma3, len3, ma_3_type))
ema4 = security(syminfo.tickerid, timeframe.period, ma_function(src_ma4, len4, ma_4_type))
ema5 = security(syminfo.tickerid, timeframe.period, ma_function(src_ma5, len5, ma_5_type))
ema6 = security(syminfo.tickerid, timeframe.period, ma_function(src_ma6, len6, ma_6_type))
ema7 = security(syminfo.tickerid, timeframe.period, ma_function(src_ma7, len7, ma_7_type))
ema8 = security(syminfo.tickerid, timeframe.period, ma_function(src_ma8, len8, ma_8_type))

plot(len1bool and switch_ema ? ema1:na, color=ma_1_colour, linewidth=1, title='MA 1')
plot(len2bool and switch_ema? ema2:na, color=ma_2_colour, linewidth=1, title='MA 2')
plot(len3bool and switch_ema? ema3:na, color=ma_3_colour, linewidth=1, title='MA 3')
plot(len4bool and switch_ema? ema4:na, color=ma_4_colour, linewidth=1, title='MA 4')
plot(len5bool and switch_ema? ema5:na, color=ma_5_colour, linewidth=1, title='MA 5')
plot(len6bool and switch_ema? ema6:na, color=ma_6_colour, linewidth=2, title='MA 6')
plot(len7bool and switch_ema? ema7:na, color=ma_7_colour, linewidth=1, title='MA 7')
plot(len8bool and switch_ema? ema8:na, color=ma_8_colour, linewidth=1, title='MA 8')


// get Pivot High/Low
float ph = pivothigh(prd, prd)
float pl = pivotlow(prd, prd)

// drawl Pivot Points if "showpivot" is enabled
plotshape(ph and showpivot, text="H",  style=shape.labeldown, color=na, textcolor=color.red, location=location.abovebar, transp=0, offset = -prd)
plotshape(pl and showpivot, text="L",  style=shape.labeldown, color=na, textcolor=color.lime, location=location.belowbar, transp=0, offset = -prd)

// calculate the Center line using pivot points
var float center = na
float lastpp = ph ? ph : pl ? pl : na
if lastpp
    if na(center)
        center := lastpp
    else
        //weighted calculation
        center := (center * 2 + lastpp) / 3

// upper/lower bands calculation
Up = center - (Factor * atr(Pd))
Dn = center + (Factor * atr(Pd))

// get the trend
float TUp = na
float TDown = na
Trend = 0
TUp := close[1] > TUp[1] ? max(Up, TUp[1]) : Up
TDown := close[1] < TDown[1] ? min(Dn, TDown[1]) : Dn
Trend := close > TDown[1] ? 1: close < TUp[1]? -1: nz(Trend[1], 1)
Trailingsl = Trend == 1 ? TUp : TDown

// plot the trend
linecolor = Trend == 1 and nz(Trend[1]) == 1 ? color.lime : Trend == -1 and nz(Trend[1]) == -1 ? color.red : na
plot(Trailingsl, color = linecolor ,  linewidth = 2, title = "PP SuperTrend")

plot(showcl ? center : na, color = showcl ? center < hl2 ? color.blue : color.red : na)

// check and plot the signals
bsignal = Trend == 1 and Trend[1] == -1
ssignal = Trend == -1 and Trend[1] == 1
plotshape(bsignal and showlabel ? Trailingsl : na, title="Buy", text="Buy", location = location.absolute, style = shape.labelup, size = size.tiny, color = color.lime, textcolor = color.black, transp = 0)
plotshape(ssignal and showlabel ? Trailingsl : na, title="Sell", text="Sell", location = location.absolute, style = shape.labeldown, size = size.tiny, color = color.red, textcolor = color.white, transp = 0)

//get S/R levels using Pivot Points
float resistance = na
float support = na
support := pl ? pl : support[1]
resistance := ph ? ph : resistance[1]

// if enabled then show S/R levels
plot(showsr and support ? support : na, color = showsr and support ? color.lime : na, style = plot.style_circles, offset = -prd)
plot(showsr and resistance ? resistance : na, color = showsr and resistance ? color.red : na, style = plot.style_circles, offset = -prd)

// Trend Filter from SuperTrend Long Strategy
Periods = input(title="ATR Period", type=input.integer, defval=3)
src = input(hlc3, title="Source")
Multiplier = input(title="ATR Multiplier", type=input.float, step=0.1, defval=4.0)
changeATR = input(title="Change ATR Calculation Method ?", type=input.bool, defval=true)

// Combine the SuperTrend calculations
atr2 = sma(tr, Periods)
atr = changeATR ? atr(Periods) : atr2

up = src - (Multiplier * atr)
up1 = nz(up[1], up)
up := close[1] > up1 ? max(up, up1) : up

dn = src + (Multiplier * atr)
dn1 = nz(dn[1], dn)
dn := close[1] < dn1 ? min(dn, dn1) : dn

trend = 1
trend := nz(trend[1], trend)
trend := trend == -1 and close > dn1 ? 1 : trend == 1 and close < up1 ? -1 : trend

// Moving Average as Trend Filter
periodes_ma = input(title="Moving Average Period", type=input.integer, defval=20)
src_ma = input(title="Moving Average Source", type=input.source, defval=close)
ma = sma(src_ma, periodes_ma)

// Strategy Entry Conditions
FromMonth = input(defval = 1, title = "From Month", minval = 1, maxval = 12)
FromDay   = input(defval = 1, title = "From Day", minval = 1, maxval = 31)
FromYear  = input(defval = 2017, title = "From Year", minval = 999)
ToMonth   = input(defval = 1, title = "To Month", minval = 1, maxval = 12)
ToDay     = input(defval = 1, title = "To Day", minval = 1, maxval = 31)
ToYear    = input(defval = 9999, title = "To Year", minval = 999)

start     = timestamp(FromYear, FromMonth, FromDay, 00, 00)
finish    = timestamp(ToYear, ToMonth, ToDay, 23, 59)

window()  => true

// Combined entry conditions
longCondition = (trend == 1 and trend[1] == -1 and close > ma) or (bsignal and window())
shortCondition = (trend == -1 and trend[1] == 1 and close < ma) or (ssignal and window())

if (longCondition)
    strategy.entry("BUY", strategy.long)

if (shortCondition)
    strategy.close("BUY")
    strategy.entry("SELL", strategy.short)

buy1 = barssince((trend == 1 and trend[1] == -1 and close > ma) or (bsignal and window()))
sell1 = barssince((trend == -1 and trend[1] == 1 and close < ma) or (ssignal and window()))
color1 = buy1[1] < sell1[1] ? color.green : buy1[1] > sell1[1] ? color.red : na
barcolor(color1)