TrendHunter w/MF - Chiến lược xu hướng đa khung thời gian

Tổng quan
TrendHunter w/MF Chiến lược xu hướng đa khung thời gian là một chiến lược giao dịch theo xu hướng dựa trên nhiều chỉ báo kỹ thuật và phân tích đa khung thời gian. Chiến lược này kết hợp xem xét các yếu tố như đám mây thị trường, đường trung bình, SuperTrend, WaveTrend và dòng tiền, xác định điểm vào lệnh thông qua các điều kiện chặt chẽ để nắm bắt xu hướng chính của thị trường.
Nguyên lý chiến lược
Nguyên lý cốt lõi của chiến lược dựa trên phân tích tổng hợp nhiều chỉ báo kỹ thuật trên nhiều khung thời gian. Cụ thể:
-
Đám mây Ichimoku (Ichimoku Cloud): Phân tích vị trí tương đối giữa giá và đám mây, cũng như vị trí tương đối giữa đường trung bình và đám mây, để xác định xu hướng thị trường hiện tại. Khi giá nằm trên đám mây và đường trung bình cũng nằm trên đám mây, được coi là xu hướng tăng; ngược lại là xu hướng giảm.
-
SuperTrend: Phân tích vị trí tương đối giữa giá và SuperTrend để xác nhận xu hướng thị trường hiện tại. Khi giá nằm trên SuperTrend, được coi là xu hướng tăng; ngược lại là xu hướng giảm.
-
WaveTrend: Phân tích hướng đi và vị trí của chỉ báo WaveTrend để xác định xu hướng thị trường hiện tại. Khi WaveTrend hướng lên và chưa chạm vùng quá mua, được coi là xu hướng tăng; khi WaveTrend hướng xuống và chưa chạm vùng quá bán, được coi là xu hướng giảm.
-
Dòng tiền (MoneyFlow): Phân tích trạng thái của chỉ báo dòng tiền để xác nhận xu hướng thị trường hiện tại. Khi dòng tiền dương, được coi là xu hướng tăng; ngược lại là xu hướng giảm.
Khi mua (long), chiến lược yêu cầu giá nằm trên đám mây, đường trung bình nằm trên đám mây, SuperTrend hướng lên, WaveTrend hướng lên và chưa chạm vùng quá mua, và dòng tiền dương. Bán (short) thì ngược lại. Sự lọc chặt chẽ với nhiều chỉ báo và nhiều khung thời gian này có thể tránh hiệu quả việc giao dịch thường xuyên trong thị trường đi ngang, từ đó nâng cao tính ổn định và độ tin cậy của chiến lược.
Phân tích ưu điểm
-
Đánh giá tổng hợp nhiều chỉ báo, độ tin cậy cao: Chiến lược xem xét tổng hợp nhiều chỉ báo kỹ thuật, các chỉ báo này bổ sung cho nhau trong các trạng thái thị trường khác nhau, phản ánh toàn diện xu hướng thị trường, tránh sai sót có thể xảy ra khi chỉ sử dụng một chỉ báo duy nhất.
-
Điều kiện vào lệnh chặt chẽ, tránh giao dịch thường xuyên: Chiến lược thiết lập điều kiện vào lệnh nghiêm ngặt, nhiều chỉ báo cần đồng thời thỏa mãn mới được vào lệnh, điều này tránh hiệu quả giao dịch thường xuyên trong thị trường đi ngang, giảm hao mòn của chiến lược.
-
Phân tích đa khung thời gian, nắm bắt xu hướng lớn: Chiến lược phân tích trên nhiều khung thời gian, giúp chiến lược nắm bắt xu hướng chính của thị trường từ góc nhìn rộng hơn, tránh bị nhiễu bởi tiếng ồn ngắn hạn.
-
Chiến lược cắt lỗ rõ ràng, kiểm soát rủi ro: Chiến lược sử dụng SuperTrend làm điều kiện cắt lỗ, một khi xu hướng thị trường thay đổi, chiến lược có thể cắt lỗ kịp thời, kiểm soát tổn thất trong phạm vi chấp nhận được.
Phân tích rủi ro
-
Thiếu điều chỉnh linh hoạt, khả năng thích ứng với biến động thị trường hạn chế: Các tham số của chiến lược được thiết lập cố định, thiếu khả năng điều chỉnh linh hoạt theo trạng thái thị trường. Khi trạng thái thị trường thay đổi đáng kể, chiến lược có thể mất hiệu quả.
-
Điều kiện vào lệnh quá chặt chẽ, có thể bỏ lỡ cơ hội: Điều kiện vào lệnh của chiến lược rất nghiêm ngặt, mặc dù điều này tránh được giao dịch thường xuyên, nhưng cũng có thể khiến chiến lược bỏ lỡ một số cơ hội vào lệnh tốt.
-
Khả năng thích ứng với các biến động cực đoan chưa được kiểm chứng: Chiến lược hoạt động tốt trong điều kiện thị trường bình thường, nhưng khả năng thích ứng với các biến động cực đoan như biến động nhanh và mạnh vẫn cần được kiểm nghiệm.
-
Chiến lược cắt lỗ tương đối đơn giản, có không gian tối ưu: Hiện tại chiến lược chỉ sử dụng SuperTrend làm điều kiện cắt lỗ, mặc dù đơn giản rõ ràng, nhưng chiến lược cắt lỗ vẫn có không gian tối ưu hóa thêm để kiểm soát rủi ro tốt hơn.
Hướng tối ưu
-
Đưa vào đánh giá trạng thái thị trường, điều chỉnh tham số linh hoạt: Có thể cân nhắc đưa vào các chỉ báo đánh giá trạng thái thị trường như chỉ báo biến động, điều chỉnh tham số chiến lược linh hoạt theo sự thay đổi trạng thái thị trường để thích ứng với các môi trường thị trường khác nhau.
-
Tối ưu điều kiện vào lệnh, tăng độ nhạy: Có thể cân nhắc tối ưu hóa điều kiện vào lệnh, chẳng hạn đưa vào thêm các chỉ báo xác nhận, để vừa đảm bảo độ tin cậy vừa tăng độ nhạy của chiến lược, nắm bắt được nhiều cơ hội giao dịch hơn.
-
Bổ sung biện pháp đối phó với biến động cực đoan: Đối với một số biến động cực đoan như biến động nhanh và mạnh, có thể cân nhắc đưa vào các biện pháp đặc biệt như tăng mức cắt lỗ, hoặc tạm dừng giao dịch, nhằm giảm rủi ro của chiến lược trong điều kiện thị trường cực đoan.
-
Tối ưu chiến lược cắt lỗ, nâng cao khả năng kiểm soát rủi ro: Có thể cân nhắc đưa vào thêm các điều kiện cắt lỗ như cắt lỗ theo thời gian, cắt lỗ biên độ, cũng như các chiến lược cắt lỗ linh hoạt như trailing stop, để kiểm soát rủi ro tốt hơn.
Tổng kết
TrendHunter w/MF Chiến lược xu hướng đa khung thời gian là một chiến lược giao dịch theo xu hướng dựa trên phân tích đa chỉ báo và đa khung thời gian. Bằng cách xem xét tổng hợp các yếu tố như đám mây thị trường, đường trung bình, SuperTrend, WaveTrend và dòng tiền, thiết lập điều kiện vào lệnh chặt chẽ, cùng với phân tích đa khung thời gian, chiến lược có thể nắm bắt tương đối đáng tin cậy các xu hướng chính của thị trường, tránh giao dịch thường xuyên trong thị trường đi ngang, có tính ổn định và độ tin cậy tốt.
Đồng thời, chiến lược cũng tồn tại một số hạn chế và rủi ro như thiếu khả năng điều chỉnh linh hoạt, điều kiện vào lệnh có thể quá chặt chẽ, khả năng thích ứng với biến động cực đoan chưa được kiểm chứng, và chiến lược cắt lỗ tương đối đơn giản. Đây là những hướng có thể tối ưu và cải tiến trong tương lai cho chiến lược này.
Nhìn chung, TrendHunter w/MF Chiến lược xu hướng đa khung thời gian là một chiến lược giao dịch theo xu hướng có tiềm năng tốt. Khi sử dụng chiến lược này, nhà giao dịch cần hiểu rõ nguyên lý, ưu điểm và rủi ro của nó, đồng thời thực hiện các điều chỉnh và tối ưu cần thiết dựa trên khẩu vị rủi ro và phong cách giao dịch của bản thân. Bên cạnh đó, cũng cần theo dõi sát sao sự thay đổi trạng thái thị trường, kịp thời điều chỉnh chiến lược để thích ứng với biến động của thị trường. Chỉ trên cơ sở hiểu biết sâu sắc và sử dụng thận trọng, chiến lược này mới có thể phát huy tiềm năng vốn có, mang lại lợi nhuận ổn định cho nhà giao dịch.
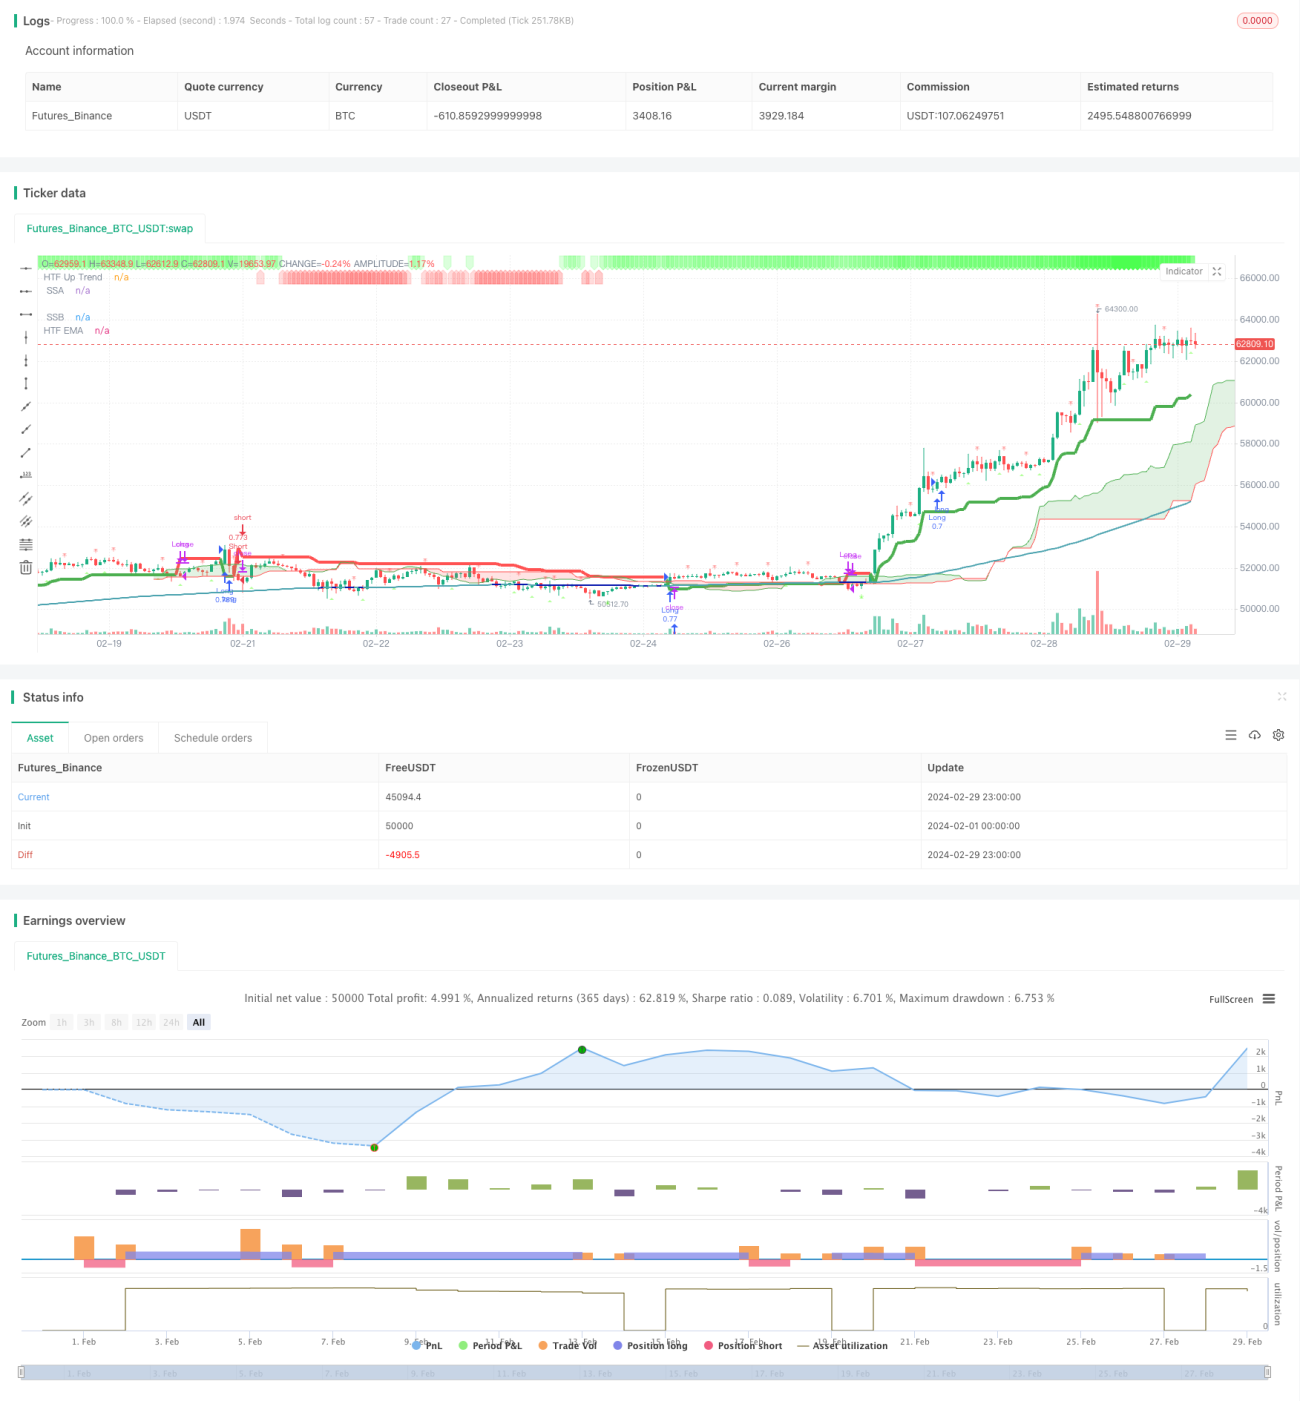
/*backtest
start: 2024-02-01 00:00:00
end: 2024-02-29 23:59:59
period: 1h
basePeriod: 15m
exchanges: [{"eid":"Futures_Binance","currency":"BTC_USDT"}]
*/

// This Pine Script™ code is subject to the terms of the Mozilla Public License 2.0 at https://mozilla.org/MPL/2.0/
// © godzcopilot / blockybears

// Thanks to anthonyf50 for his MTF Ichimoku https://www.tradingview.com/script/Pw9cBFma/- 1