Dự đoán điểm cao và điểm thấp tự động và chiến lược giao dịch
Ngày tạo:
2024-03-15 17:22:36
sửa đổi lần cuối:
2024-03-15 17:22:36
sao chép:
6
Số nhấp chuột:
785
1
tập trung vào
1751
Người theo dõi
Tổng quan
Chiến lược này sử dụng các chỉ số tương đối mạnh (RSI) để đánh giá tình trạng quá mua và quá bán, kết hợp với sự phá vỡ của điểm thấp cao 9:15 để xác định cơ hội vào thị trường.
Nguyên tắc chiến lược
- Xác định khoảng từ 9:00 đến 9:15 là điểm cao và thấp.
- Giá cao nhất và giá thấp nhất được ghi nhận vào lúc 09:15 là sessionHigh và sessionLow.
- Các mục tiêu đa đầu (sessionHigh+200), mục tiêu đầu không (sessionLow-200) và giá dừng lỗ tương ứng được tính.
- Lưu trữ giá đóng cửa hiện tại và chỉ số RSI.
- Điều kiện mở nhiều đầu: Giá đóng cửa vượt quá phiên cao và RSI lớn hơn mức mua quá mức.
- Điều kiện mở đầu trống: Giá đóng cửa giảm xuống dưới mức sessionLow và RSI nhỏ hơn mức bán tháo.
- Tạo một bản đồ giá liên quan và tự động mở đầu hoặc đầu trống tùy thuộc vào điều kiện mở vị trí.
Phân tích lợi thế
- Dễ sử dụng: Chiến lược dựa trên các điểm cao và thấp 9:15 và chỉ số RSI rõ ràng, logic rõ ràng, dễ hiểu và thực hiện
- Mức độ tự động hóa cao: Chiến lược có tính toán giá mục tiêu và giá dừng lỗ và phán đoán về điều kiện mở vị trí, có thể tự động thực hiện giao dịch.
- Đặt mức dừng chân kịp thời: Đặt mức dừng chân theo mức cao và thấp 9:15, có mức dừng chân rõ ràng khi mở vị trí, có thể kiểm soát rủi ro hiệu quả.
- Theo dõi xu hướng: đánh giá quá mua và quá bán thông qua chỉ số RSI, can thiệp vào xu hướng khi nó mới hình thành, giúp theo dõi xu hướng.
Phân tích rủi ro
- Rủi ro tối ưu hóa tham số: Các tham số chiến lược như chiều dài của RSI và thềm mua bán quá mức cần được tối ưu hóa theo đặc điểm của thị trường, các tham số khác nhau có thể mang lại kết quả khác nhau.
- Rủi ro chỉ số duy nhất: Chiến lược phụ thuộc chủ yếu vào chỉ số RSI, trong một số trường hợp thị trường có thể xảy ra sự thất bại của chỉ số.
- Rủi ro biến động trong thị trường: Sự biến động của giá sau 9:15 có thể gây ra lệnh dừng lỗ và mất xu hướng.
- Thiếu quản lý vị trí: Chiến lược thiếu kiểm soát vị trí và quản lý tiền, quá thường xuyên mở vị trí có thể mang lại rủi ro bổ sung.
Hướng tối ưu hóa
- Hạn chế động: Điều chỉnh động điểm dừng dựa trên các chỉ số như tỷ lệ biến động giá hoặc ATR, theo dõi sự thay đổi giá.
- Kết hợp với các chỉ số khác: giới thiệu các chỉ số khác như MACD, hệ thống đường trung bình để xác nhận xu hướng, tăng độ chính xác mở vị trí.
- Tối ưu hóa điều kiện nhập cảnh: Điều chỉnh thích nghi cho RSI vượt ngưỡng mua và bán để tránh các hạn chế của mức giá cố định.
- Khởi động quản lý vị trí: Kiểm soát vị trí tùy theo tình trạng biến động của thị trường, ví dụ như sử dụng mô hình rủi ro phần trăm.
Tóm tắt
Chiến lược này dựa trên điểm cao thấp 9:15, sử dụng chỉ số RSI để đánh giá xu hướng, tự động tính giá mục tiêu và giá dừng lỗ và tự động mở vị trí đầu nhiều hoặc đầu trống tùy theo điều kiện mở vị trí. Logic của chiến lược đơn giản, mức độ tự động hóa cao, có thể nhanh chóng nắm bắt xu hướng. Tuy nhiên, chiến lược cũng có rủi ro về tối ưu hóa tham số, bảng chỉ số đơn, dao động trung bình và quản lý vị trí.
Mã nguồn chiến lược
/*backtest
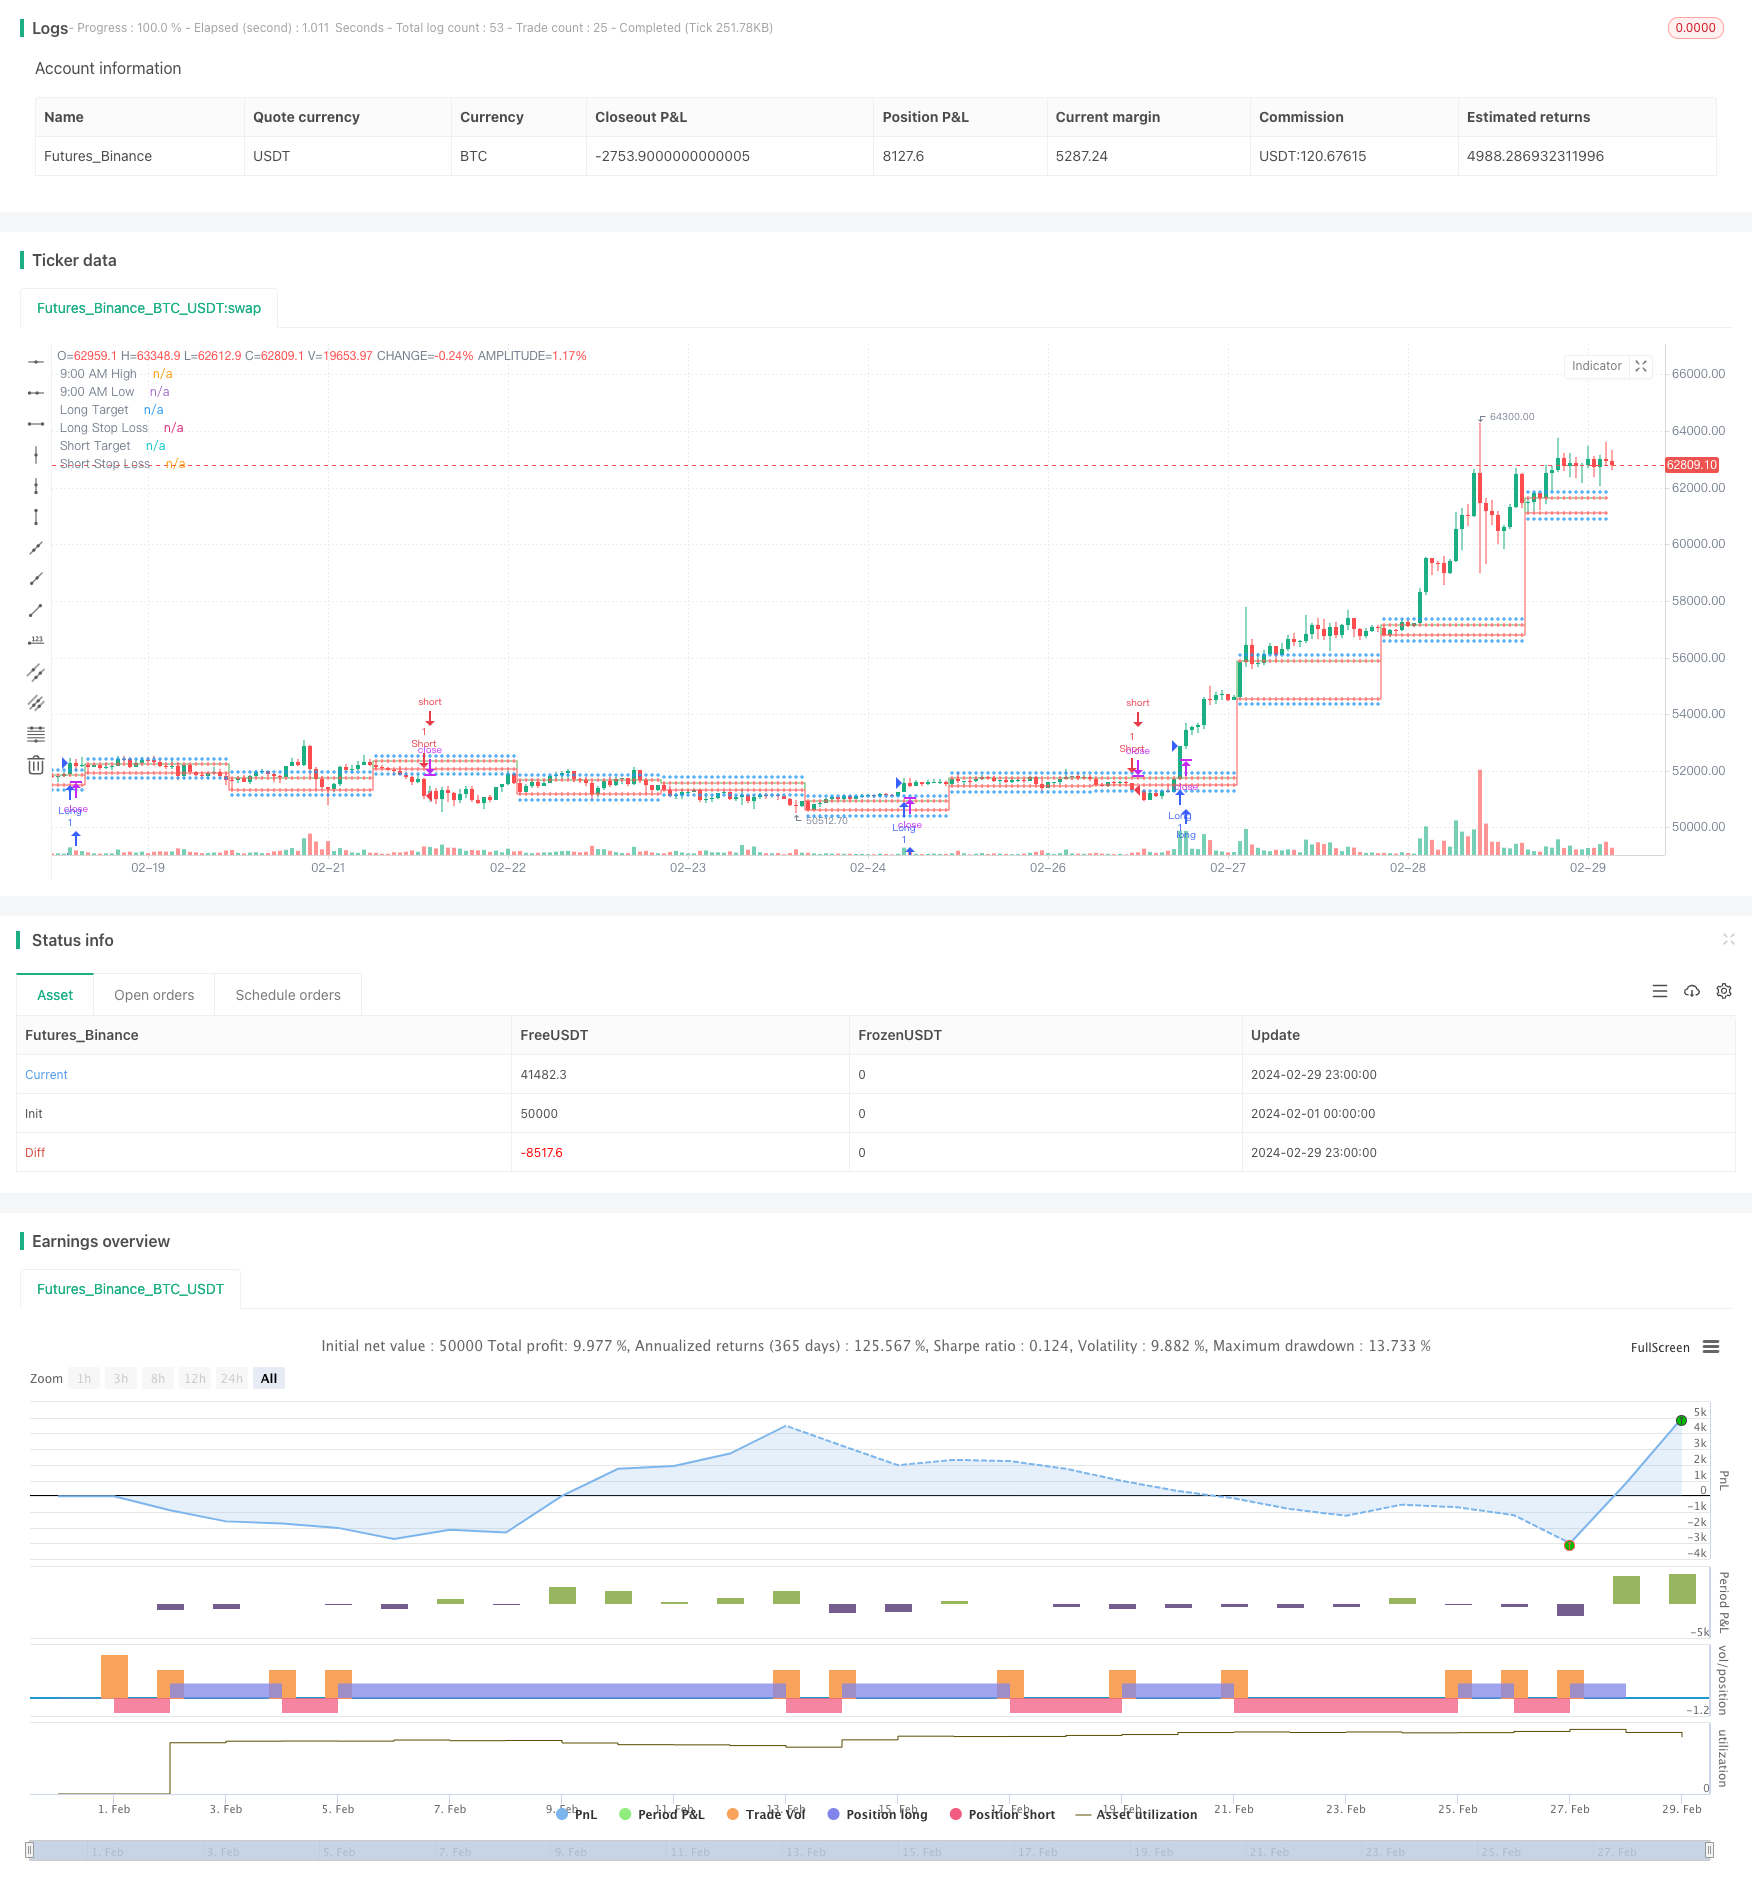
start: 2024-02-01 00:00:00
end: 2024-02-29 23:59:59
period: 1h
basePeriod: 15m
exchanges: [{"eid":"Futures_Binance","currency":"BTC_USDT"}]
*/
//@version=5
strategy("9:15 AM High/Low with Automatic Forecasting", overlay=true)
// Parameters
showSignals = input(true, title="Show Signals")
// Define session time
sessionStartHour = input(9, title="Session Start Hour")
sessionStartMinute = input(0, title="Session Start Minute")
sessionEndHour = input(9, title="Session End Hour")
sessionEndMinute = input(15, title="Session End Minute")
// Calculate session high and low
var float sessionHigh = na
var float sessionLow = na
if (hour == sessionStartHour and minute == sessionStartMinute)
sessionHigh := high
sessionLow := low
// Update session high and low if within session time
if (hour == sessionStartHour and minute >= sessionStartMinute and minute < sessionEndMinute)
sessionHigh := high > sessionHigh or na(sessionHigh) ? high : sessionHigh
sessionLow := low < sessionLow or na(sessionLow) ? low : sessionLow
// Plot horizontal lines for session high and low
plot(sessionHigh, color=color.green, title="9:00 AM High", style=plot.style_stepline, linewidth=1)
plot(sessionLow, color=color.red, title="9:00 AM Low", style=plot.style_stepline, linewidth=1)
// Calculate targets and stop loss
longTarget = sessionHigh + 200
longStopLoss = sessionLow
shortTarget = sessionLow - 200
shortStopLoss = sessionHigh
// Plot targets and stop loss
plot(longTarget, color=color.blue, title="Long Target", style=plot.style_cross, linewidth=1)
plot(longStopLoss, color=color.red, title="Long Stop Loss", style=plot.style_cross, linewidth=1)
plot(shortTarget, color=color.blue, title="Short Target", style=plot.style_cross, linewidth=1)
plot(shortStopLoss, color=color.red, title="Short Stop Loss", style=plot.style_cross, linewidth=1)
// RSI
rsiLength = input(14, title="RSI Length")
overboughtLevel = input(60, title="Overbought Level")
oversoldLevel = input(40, title="Oversold Level")
rsi = ta.rsi(close, rsiLength)
// Entry conditions
longCondition = close > sessionHigh and rsi > overboughtLevel
shortCondition = close < sessionLow and rsi < oversoldLevel
// Long entry
if (showSignals and longCondition)
strategy.entry("Long", strategy.long)
// Short entry
if (showSignals and shortCondition)
strategy.entry("Short", strategy.short)