Chiến lược Kuberan: Chiến lược giao thoa để kiểm soát thị trường
Tổng quan về chiến lược
Chiến lược Kuberan là một chiến lược giao dịch mạnh mẽ được viết bởi Kathir. Nó kết hợp nhiều kỹ thuật phân tích để tạo ra một phương pháp giao dịch độc đáo và mạnh mẽ. Chiến lược này được đặt tên theo Kuberan, vị thần của sự giàu có, tượng trưng cho mục tiêu làm phong phú danh mục đầu tư của các nhà giao dịch.
Kuberan không chỉ là một chiến lược mà còn là một hệ thống giao dịch toàn diện. Nó kết hợp phân tích xu hướng, chỉ số động lực và chỉ số khối lượng giao dịch để xác định các cơ hội giao dịch có khả năng cao. Bằng cách sử dụng sự phối hợp của các yếu tố này, Kuberan cung cấp tín hiệu vào và ra rõ ràng, phù hợp với các nhà giao dịch ở mọi cấp độ.
Nguyên tắc chiến lược
Cốt lõi của chiến lược Kuberan là nguyên tắc giao thoa đa chỉ số. Nó sử dụng một tổ hợp chỉ số độc đáo, các chỉ số này phối hợp với nhau để giảm tiếng ồn và tín hiệu sai. Cụ thể, chiến lược sử dụng một số thành phần quan trọng sau:
- Xác định hướng xu hướng: Xác định hướng xu hướng hiện tại bằng cách so sánh giá hiện tại với mức hỗ trợ và kháng cự.
- Hỗ trợ và kháng cự: Xác định các điểm hỗ trợ và kháng cự quan trọng thông qua các chỉ số zigzag và các điểm trung tâm.
- Xác định sự lệch lạc: Xác định sự lệch lạc bằng cách so sánh xu hướng giá với chỉ số động lực, gợi ý sự đảo ngược xu hướng tiềm ẩn.
- Tỷ lệ biến động tự điều chỉnh: Đổi đổi mức dừng động thông qua chỉ số ATR để phù hợp với tỷ lệ biến động thị trường khác nhau.
- Phán định kiểu K: xác nhận xu hướng và tín hiệu đảo ngược thông qua các kết hợp K cụ thể.
Bằng cách cân nhắc toàn diện các yếu tố trên, Kuberan có thể điều chỉnh các chiến lược trong các môi trường thị trường khác nhau để nắm bắt các cơ hội giao dịch có xác suất cao.
Lợi thế chiến lược
- Nhiều chỉ số giao thoa: Chiến lược Kuberan sử dụng sự phối hợp của nhiều chỉ số, làm tăng đáng kể độ tin cậy tín hiệu và giảm nhiễu tiếng ồn.
- Khả năng thích ứng: Bằng cách điều chỉnh các tham số một cách động, chiến lược này có thể thích ứng với môi trường thị trường thay đổi và không dễ bị thất bại.
- Dấu hiệu rõ ràng: Kuberan cung cấp tín hiệu rõ ràng về nhập cảnh và xuất cảnh, đơn giản hóa quá trình ra quyết định giao dịch.
- Đánh giá vững chắc: Chiến lược này đã trải qua quá trình đánh giá lịch sử nghiêm ngặt và hoạt động ổn định trong nhiều tình huống thị trường.
- Khả năng sử dụng rộng rãi: Kuberan có thể được sử dụng cho nhiều thị trường và giống, không giới hạn trong một thương hiệu cụ thể.
Rủi ro chiến lược
- Nhận thức tham số: Hiệu suất của Kuberan là nhạy cảm với lựa chọn tham số, tham số không đúng có thể dẫn đến giảm hiệu suất.
- Sự kiện bất ngờ: Chiến lược này chủ yếu dựa trên tín hiệu kỹ thuật và có khả năng đáp ứng với các sự kiện bất ngờ cơ bản.
- Rủi ro quá phù hợp: Nếu quá nhiều dữ liệu lịch sử được xem xét khi tối ưu hóa tham số, nó có thể dẫn đến chiến lược quá phù hợp với quá khứ và giảm khả năng thích ứng với tình hình thị trường trong tương lai.
- Rủi ro đòn bẩy: Nếu sử dụng đòn bẩy cao, có nguy cơ phá sản khi rút lớn.
Đối với các rủi ro trên, có thể thực hiện các biện pháp kiểm soát thích hợp, chẳng hạn như điều chỉnh các tham số thường xuyên, thiết lập dừng hợp lý, kiểm soát đòn bẩy vừa phải, chú ý đến các thay đổi cơ bản.
Hướng tối ưu hóa
- Tối ưu hóa học máy: Có thể giới thiệu các thuật toán học máy để tối ưu hóa các tham số chiến lược động, cải thiện khả năng thích ứng.
- Thêm các yếu tố cơ bản: Xem xét việc đưa phân tích cơ bản vào các quyết định giao dịch để đối phó với các trường hợp tín hiệu kỹ thuật không hoạt động.
- Quản lý danh mục đầu tư: Ở cấp độ quản lý tài chính, Kuberan có thể được đưa vào danh mục đầu tư để tạo ra một biện pháp bảo vệ hiệu quả với các chiến lược khác.
- Tối ưu hóa phân khúc thị trường: Đặc điểm cho các loại thị trường khác nhau, tùy chỉnh các tham số chiến lược tối ưu hóa.
- Chuyển đổi tần số cao: Chuyển đổi chiến lược sang phiên bản giao dịch tần số cao để nắm bắt nhiều cơ hội giao dịch ngắn hơn.
Tóm tắt
Kuberan là một chiến lược giao dịch mạnh mẽ, an toàn và đáng tin cậy. Nó kết hợp một số phương pháp phân tích kỹ thuật một cách khéo léo, hoạt động tốt trong việc nắm bắt xu hướng và nắm bắt các bước ngoặt thông qua các nguyên tắc giao dịch chỉ số. Mặc dù bất kỳ chiến lược nào cũng gặp rủi ro, Kuberan đã chứng minh được sự mạnh mẽ của nó trong đánh giá lại, và với các biện pháp kiểm soát và tối ưu hóa rủi ro thích hợp, Kuberan tin rằng chiến lược này có thể giúp các nhà giao dịch nắm giữ lợi thế trong trò chơi thị trường và thúc đẩy sự tăng trưởng ổn định lâu dài của danh mục đầu tư.
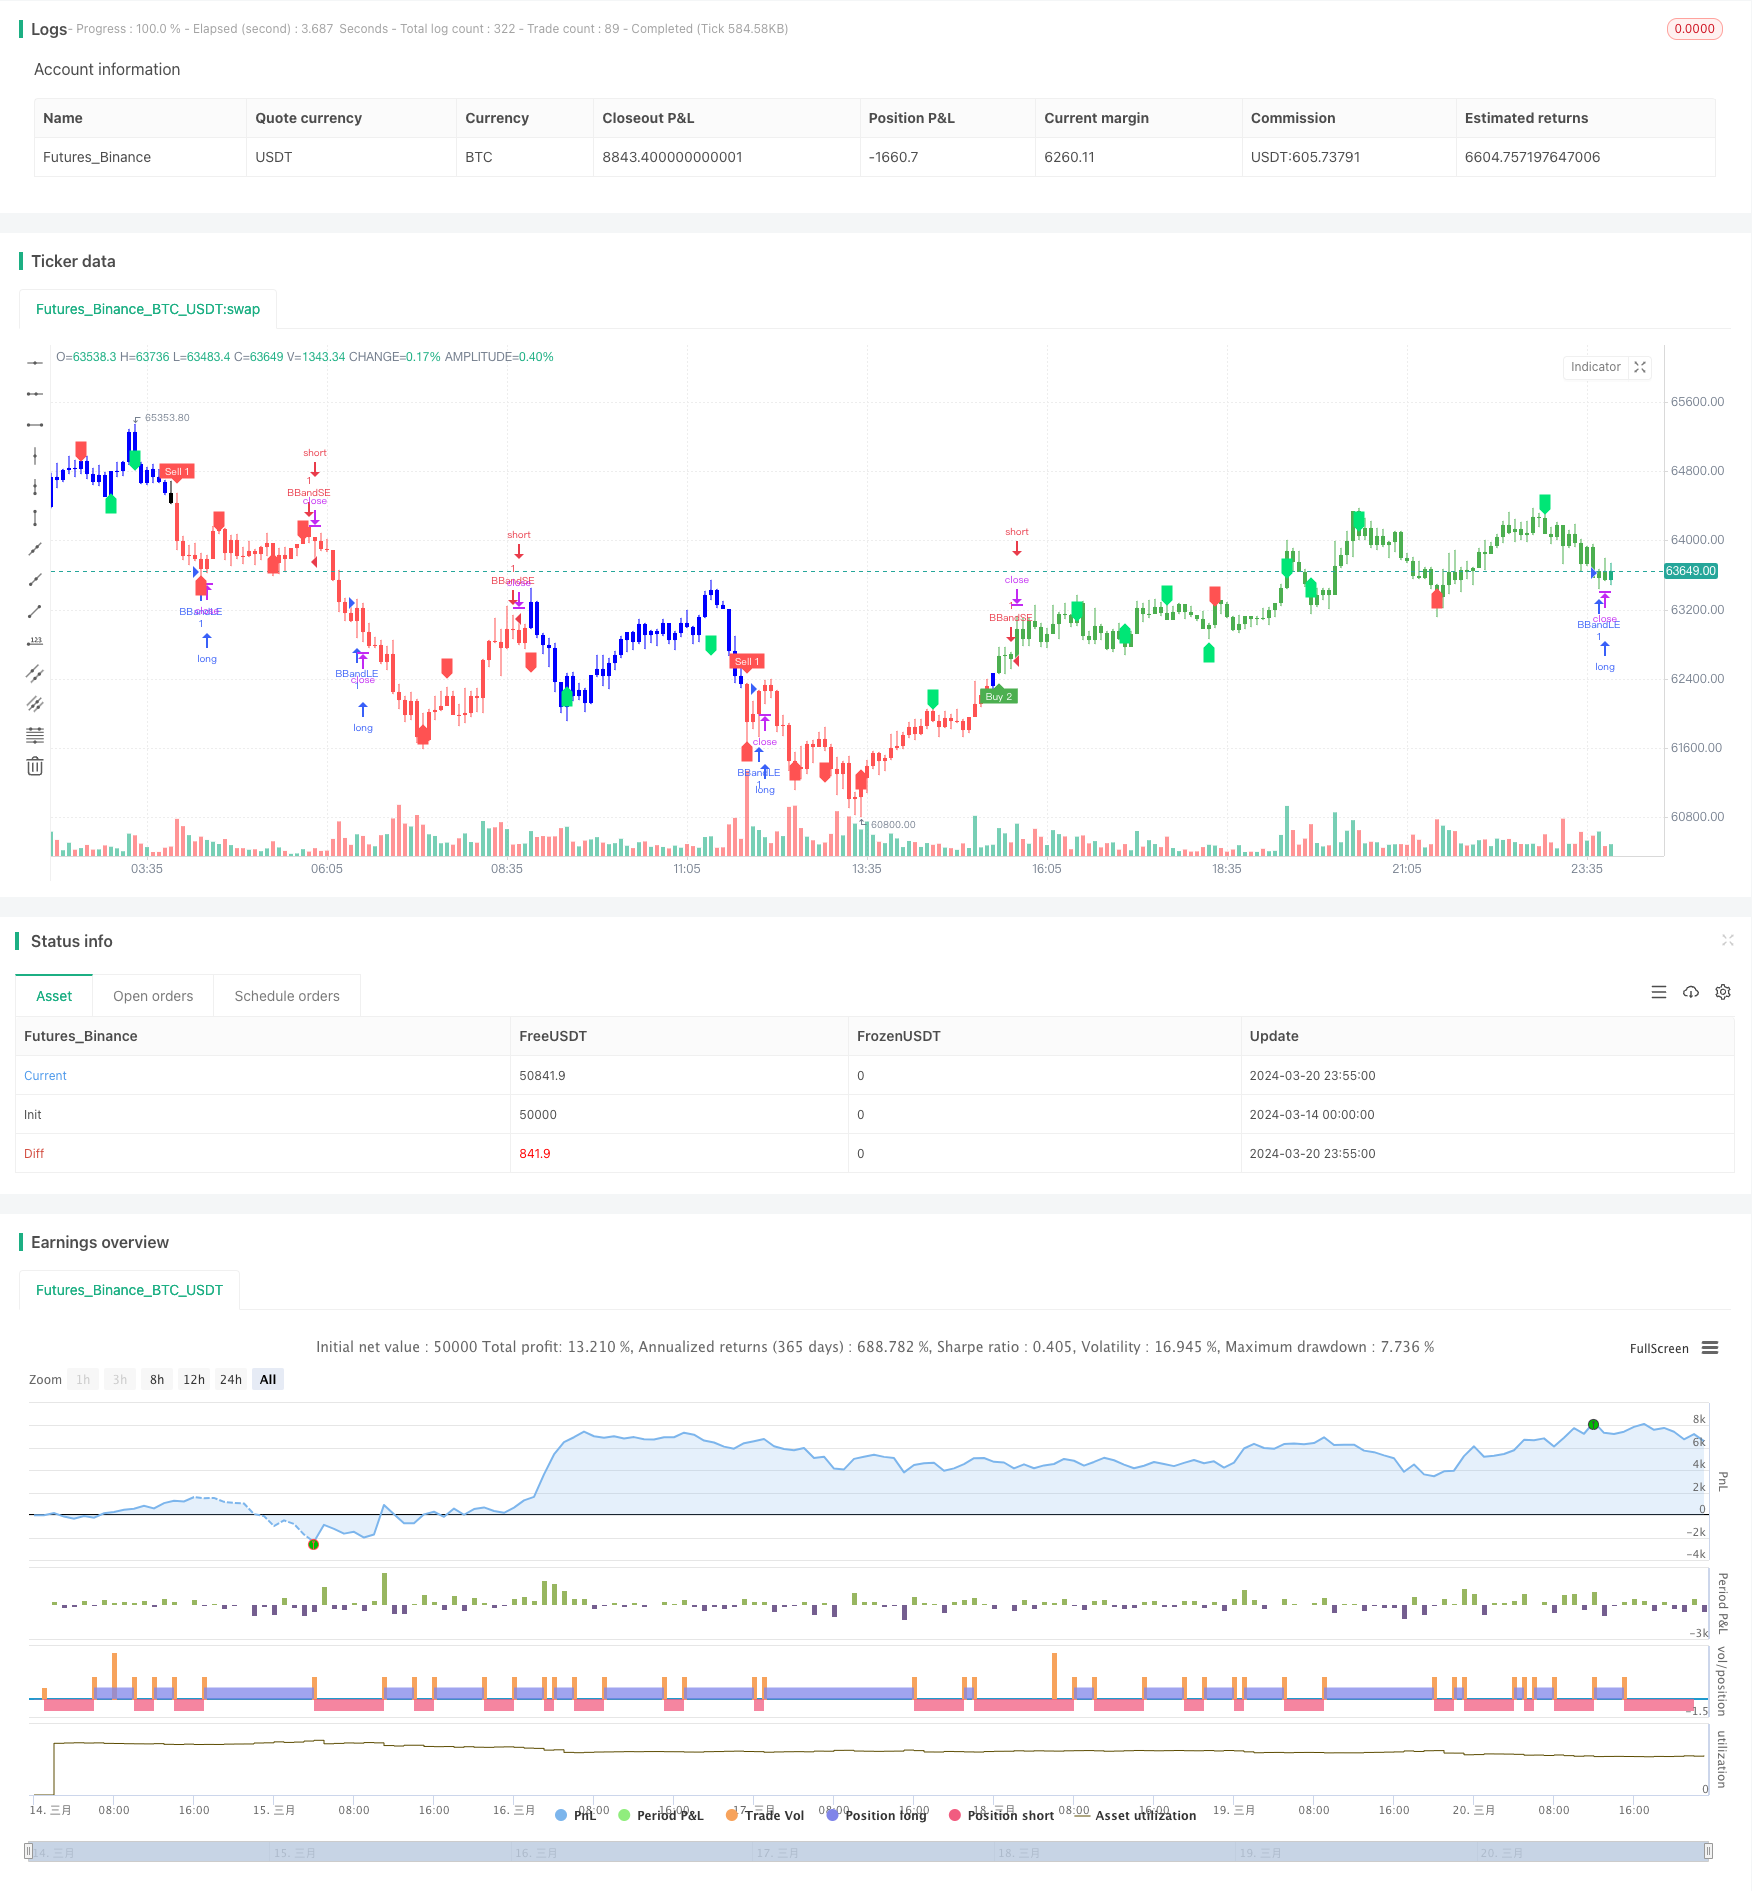
/*backtest
start: 2024-03-14 00:00:00
end: 2024-03-21 00:00:00
period: 5m
basePeriod: 1m
exchanges: [{"eid":"Futures_Binance","currency":"BTC_USDT"}]
*/

// This source code is subject to the terms of the Mozilla Public License 2.0 at https://mozilla.org/MPL/2.0/
// © LonesomeThecolor.blue
// This source code is subject to the terms of the Mozilla Public License 2.0 at https://mozilla.org/MPL/2.0/
// © LonesomeThecolor.blue

//@version=5
strategy('Kuberan*', overlay=true, max_lines_count=500)
lb = input.int(5, title='Left Bars', minval=1)
rb = input.int(5, title='Right Bars', minval=1)
showsupres = input.bool(false, title='Support/Resistance', inline='srcol')
supcol = input.color(color.lime, title='', inline='srcol')
rescol = input.color(color.red, title='', inline='srcol')
// srlinestyle = input(line.style_dotted, title='Line Style/Width', inline='style')
srlinewidth = input.int(3, title='', minval=1, maxval=5, inline='style')
changebarcol = input.bool(true, title='Change Bar Color', inline='bcol')
bcolup = input.color(color.blue, title='', inline='bcol')
bcoldn = input.color(color.black, title='', inline='bcol')

ph = ta.pivothigh(lb, rb)
pl = ta.pivotlow(lb, rb)

iff_1 = pl ? -1 : na  // Trend direction
hl = ph ? 1 : iff_1
iff_2 = pl ? pl : na  // similar to zigzag but may have multTLiple highs/lows
zz = ph ? ph : iff_2
valuewhen_1 = ta.valuewhen(hl, hl, 1)
valuewhen_2 = ta.valuewhen(zz, zz, 1)
zz := pl and hl == -1 and valuewhen_1 == -1 and pl > valuewhen_2 ? na : zz
valuewhen_3 = ta.valuewhen(hl, hl, 1)
valuewhen_4 = ta.valuewhen(zz, zz, 1)
zz := ph and hl == 1 and valuewhen_3 == 1 and ph < valuewhen_4 ? na : zz

valuewhen_5 = ta.valuewhen(hl, hl, 1)
valuewhen_6 = ta.valuewhen(zz, zz, 1)
hl := hl == -1 and valuewhen_5 == 1 and zz > valuewhen_6 ? na : hl
valuewhen_7 = ta.valuewhen(hl, hl, 1)
valuewhen_8 = ta.valuewhen(zz, zz, 1)
hl := hl == 1 and valuewhen_7 == -1 and zz < valuewhen_8 ? na : hl
zz := na(hl) ? na : zz

findprevious() =>  // finds previous three points (b, c, d, e)
    ehl = hl == 1 ? -1 : 1
    loc1 = 0.0
    loc2 = 0.0
    loc3 = 0.0
    loc4 = 0.0
    xx = 0
    for x = 1 to 1000 by 1
        if hl[x] == ehl and not na(zz[x])
            loc1 := zz[x]
            xx := x + 1
            break
    ehl := hl
    for x = xx to 1000 by 1
        if hl[x] == ehl and not na(zz[x])
            loc2 := zz[x]
            xx := x + 1
            break
    ehl := hl == 1 ? -1 : 1
    for x = xx to 1000 by 1
        if hl[x] == ehl and not na(zz[x])
            loc3 := zz[x]
            xx := x + 1
            break
    ehl := hl
    for x = xx to 1000 by 1
        if hl[x] == ehl and not na(zz[x])
            loc4 := zz[x]
            break
    [loc1, loc2, loc3, loc4]

float a = na
float b = na
float c = na
float d = na
float e = na
if not na(hl)
    [loc1, loc2, loc3, loc4] = findprevious()
    a := zz
    b := loc1
    c := loc2
    d := loc3
    e := loc4
    e

_hh = zz and a > b and a > c and c > b and c > d
_ll = zz and a < b and a < c and c < b and c < d
_hl = zz and (a >= c and b > c and b > d and d > c and d > e or a < b and a > c and b < d)
_lh = zz and (a <= c and b < c and b < d and d < c and d < e or a > b and a < c and b > d)

plotshape(_hl, title='Higher Low', style=shape.labelup, color=color.new(color.lime, 0), textcolor=color.new(color.black, 0), location=location.belowbar, offset=-rb)
plotshape(_hh, title='Higher High', style=shape.labeldown, color=color.new(color.lime, 0), textcolor=color.new(color.black, 0), location=location.abovebar, offset=-rb)
plotshape(_ll, title='Lower Low', style=shape.labelup, color=color.new(color.red, 0), textcolor=color.new(color.white, 0), location=location.belowbar, offset=-rb)
plotshape(_lh, title='Lower High', style=shape.labeldown, color=color.new(color.red, 0), textcolor=color.new(color.white, 0), location=location.abovebar, offset=-rb)

float res = na
float sup = na
res := _lh ? zz : res[1]
sup := _hl ? zz : sup[1]

int trend = na
iff_3 = close < sup ? -1 : nz(trend[1])
trend := close > res ? 1 : iff_3

res := trend == 1 and _hh or trend == -1 and _lh ? zz : res
sup := trend == 1 and _hl or trend == -1 and _ll ? zz : sup
rechange = res != res[1]
suchange = sup != sup[1]

var line resline = na
var line supline = na
if showsupres
    if rechange
        line.set_x2(resline, bar_index)
        line.set_extend(resline, extend=extend.none)
        resline := line.new(x1=bar_index - rb, y1=res, x2=bar_index, y2=res, color=rescol, extend=extend.right, style=line.style_dotted, width=srlinewidth)
        resline

    if suchange
        line.set_x2(supline, bar_index)
        line.set_extend(supline, extend=extend.none)
        supline := line.new(x1=bar_index - rb, y1=sup, x2=bar_index, y2=sup, color=supcol, extend=extend.right, style=line.style_dotted, width=srlinewidth)
        supline

iff_4 = trend == 1 ? bcolup : bcoldn
barcolor(color=changebarcol ? iff_4 : na)


// Inputs
A1 = input(5, title='Key Value. \'This changes the sensitivity\' for sell1')
C1 = input(400, title='ATR Period for sell1')
A2 = input(6, title='Key Value. \'This changes the sensitivity\' for buy2')
C2 = input(1, title='ATR Period for buy2')
h = input(false, title='Signals from Heikin Ashi Candles')

xATR1 = ta.atr(C1)
xATR2 = ta.atr(C2)
nLoss1 = A1 * xATR1
nLoss2 = A2 * xATR2

src = h ? request.security(ticker.heikinashi(syminfo.tickerid), timeframe.period, close, lookahead=barmerge.lookahead_off) : close

xATRTrailingStop1 = 0.0
iff_5 = src > nz(xATRTrailingStop1[1], 0) ? src - nLoss1 : src + nLoss1
iff_6 = src < nz(xATRTrailingStop1[1], 0) and src[1] < nz(xATRTrailingStop1[1], 0) ? math.min(nz(xATRTrailingStop1[1]), src + nLoss1) : iff_5
xATRTrailingStop1 := src > nz(xATRTrailingStop1[1], 0) and src[1] > nz(xATRTrailingStop1[1], 0) ? math.max(nz(xATRTrailingStop1[1]), src - nLoss1) : iff_6

xATRTrailingStop2 = 0.0
iff_7 = src > nz(xATRTrailingStop2[1], 0) ? src - nLoss2 : src + nLoss2
iff_8 = src < nz(xATRTrailingStop2[1], 0) and src[1] < nz(xATRTrailingStop2[1], 0) ? math.min(nz(xATRTrailingStop2[1]), src + nLoss2) : iff_7
xATRTrailingStop2 := src > nz(xATRTrailingStop2[1], 0) and src[1] > nz(xATRTrailingStop2[1], 0) ? math.max(nz(xATRTrailingStop2[1]), src - nLoss2) : iff_8

pos1 = 0
iff_9 = src[1] > nz(xATRTrailingStop1[1], 0) and src < nz(xATRTrailingStop1[1], 0) ? -1 : nz(pos1[1], 0)
pos1 := src[1] < nz(xATRTrailingStop1[1], 0) and src > nz(xATRTrailingStop1[1], 0) ? 1 : iff_9

pos2 = 0
iff_10 = src[1] > nz(xATRTrailingStop2[1], 0) and src < nz(xATRTrailingStop2[1], 0) ? -1 : nz(pos2[1], 0)
pos2 := src[1] < nz(xATRTrailingStop2[1], 0) and src > nz(xATRTrailingStop2[1], 0) ? 1 : iff_10

xcolor1 = pos1 == -1 ? color.red : pos1 == 1 ? color.green : color.blue
xcolor2 = pos2 == -1 ? color.red : pos2 == 1 ? color.green : color.blue

ema1 = ta.ema(src, 1)
ema2 = ta.ema(src, 1)
above1 = ta.crossover(ema1, xATRTrailingStop1)
below1 = ta.crossover(xATRTrailingStop1, ema1)
above2 = ta.crossover(ema2, xATRTrailingStop2)
below2 = ta.crossover(xATRTrailingStop2, ema2)

buy1 = src > xATRTrailingStop1 and above1
sell1 = src < xATRTrailingStop1 and below1
buy2 = src > xATRTrailingStop2 and above2
sell2 = src < xATRTrailingStop2 and below2

barbuy1 = src > xATRTrailingStop1
barsell1 = src < xATRTrailingStop1
barbuy2 = src > xATRTrailingStop2
barsell2 = src < xATRTrailingStop2

// plotshape(buy1, title="Buy 1", text='Buy 1', style=shape.labelup, location=location.belowbar, color=color.green, textcolor=color.white, transp=0, size=size.tiny)
plotshape(sell1, title='Sell 1', text='Sell 1', style=shape.labeldown, location=location.abovebar, color=color.new(color.red, 0), textcolor=color.new(color.white, 0), size=size.tiny)
plotshape(buy2, title='Buy 2', text='Buy 2', style=shape.labelup, location=location.belowbar, color=color.new(color.green, 0), textcolor=color.new(color.white, 0), size=size.tiny)
// plotshape(sell2, title="Sell 2", text='Sell 2', style=shape.labeldown, location=location.abovebar, color=color.red, textcolor=color.white, transp=0, size=size.tiny)

// barcolor(barbuy1 ? color.green : na)
barcolor(barsell1 ? color.red : na)
barcolor(barbuy2 ? color.green : na)
// barcolor(barsell2 ? color.red : na)

// alertcondition(buy1, "UT Long 1", "UT Long 1")
alertcondition(sell1, 'UT Short 1', 'UT Short 1')
alertcondition(buy2, 'UT Long 2', 'UT Long 2')

// strategy.entry('long', strategy.long, when=buy2)
source = close
length = input.int(20, minval=1)
mult = input.float(2.0, minval=0.001, maxval=50)
basis = ta.sma(source, length)
dev = mult * ta.stdev(source, length)
upper = basis + dev
lower = basis - dev
buyEntry = ta.crossover(source, lower)
sellEntry = ta.crossunder(source, upper)
if (ta.crossover(source, lower) )
	strategy.entry("BBandLE", strategy.long, stop=lower, oca_name="BollingerBands",  comment="BBandLE")
else
	strategy.cancel(id="BBandLE")
if (ta.crossunder(source, upper))
	strategy.entry("BBandSE", strategy.short, stop=upper, oca_name="BollingerBands",comment="BBandSE")
else
	strategy.cancel(id="BBandSE")
//plot(strategy.equity, title="equity", color=color.red, linewidth=2, style=plot.style_areabr)

lengthTL = input.int(14, 'Swing Detection Lookback')
multTL = input.float(1., 'Slope', minval = 0, step = .1)
calcMethod = input.string('Atr', 'Slope Calculation Method', options = ['Atr','Stdev','Linreg'])
backpaint = input(true, tooltip = 'Backpainting offset displayed elements in the past. Disable backpainting to see real time information returned by the indicator.')

//Style
upCss = input.color(color.teal, 'Up Trendline Color', group = 'Style')
dnCss = input.color(color.red, 'Down Trendline Color', group = 'Style')
showExt = input(true, 'Show Extended Lines')

//-----------------------------------------------------------------------------}
//Calculations
//-----------------------------------------------------------------------------{
var upperTL = 0.
var lowerTL = 0.
var slope_phTL = 0.
var slope_plTL = 0.

var offset = backpaint ? lengthTL : 0

n = bar_index
srcTL = close

phTL = ta.pivothigh(lengthTL, lengthTL)
plTL = ta.pivotlow(lengthTL, lengthTL)

//Slope Calculation Method
slope = switch calcMethod
    'Atr'    => ta.atr(lengthTL) / lengthTL * multTL
    'Stdev'  => ta.stdev(srcTL,lengthTL) / lengthTL * multTL
    'Linreg' => math.abs(ta.sma(srcTL * n, lengthTL) - ta.sma(srcTL, lengthTL) * ta.sma(n, lengthTL)) / ta.variance(n, lengthTL) / 2 * multTL

//Get slopes and calculate trendlines
slope_phTL := phTL ? slope : slope_phTL
slope_plTL := plTL ? slope : slope_plTL

upperTL := phTL ? phTL : upperTL - slope_phTL
lowerTL := pl ? pl : lowerTL + slope_plTL

var upos = 0
var dnos = 0
upos := phTL ? 0 : close > upperTL - slope_phTL * lengthTL ? 1 : upos
dnos := pl ? 0 : close < lowerTL + slope_plTL * lengthTL ? 1 : dnos