Chiến lược theo dõi đường trung bình động Pullback
Tổng quan
Ý tưởng chính của chiến lược này là sử dụng trung bình di chuyển của hai chu kỳ khác nhau để nắm bắt cơ hội phục hồi sau khi thị trường điều chỉnh. Chiến lược mở nhiều vị trí khi giá trên đường trung bình dài hạn và điều chỉnh lại đường trung bình ngắn hạn, và giữ vị trí bằng phẳng khi giá trở lại đường trung bình ngắn hạn hoặc chạm mức giá dừng lỗ. Chiến lược này tìm kiếm cơ hội mua lại trong xu hướng bằng cách lấy lợi nhuận trong tình huống xu hướng.
Nguyên tắc chiến lược
- Tính trung bình di chuyển của hai chu kỳ khác nhau ((MA1 và MA2), trong đó MA1 là đường trung bình dài hạn và MA2 là đường trung bình ngắn hạn.
- Khi giá đóng cửa ở trên MA1 và thấp hơn MA2, và không có vị trí hiện tại, và thời gian hiện tại trong phạm vi thời gian giao dịch được thiết lập, chiến lược mở nhiều vị trí.
- Ghi lại giá mua (buyPrice) và tính giá dừng (stopPrice).
- Khi giá đóng cửa trở lại MA2 và i_lowerClose là false, hoặc giá đóng cửa giảm xuống giá dừng lỗ, chiến lược thanh toán.
- Nếu i_lowerClose là đúng, thì sẽ bị đóng cửa khi giá đóng cửa cao hơn MA2 và giá đóng cửa trước của đường K thấp hơn MA2.
Lợi thế chiến lược
- Theo dõi xu hướng: Xác định xu hướng tổng thể hiện tại bằng cách đánh giá mối quan hệ giữa giá và vị trí của đường trung bình dài hạn, tìm kiếm cơ hội tham gia trong xu hướng.
- Mua lại: Tìm kiếm cơ hội mua để giá quay trở lại đường trung bình ngắn hạn trong xu hướng tăng, tăng tỷ lệ giá trị của mua điểm.
- Bảo vệ dừng lỗ: thiết lập giá dừng lỗ, tự động xóa vị trí khi giá biến động ngược đạt đến một mức độ nhất định, kiểm soát hiệu quả rủi ro giảm giá.
- Các tham số linh hoạt: Người dùng có thể tùy thuộc vào sở thích của mình, có thể thiết lập chu kỳ đường trung bình, tỷ lệ phần trăm dừng lỗ, và các tham số khác nhau khi giá đóng cửa K-line trước đó thấp hơn đường trung bình ngắn hạn.
Rủi ro chiến lược
- Tối ưu hóa tham số: Các thiết lập tham số khác nhau có ảnh hưởng lớn đến hiệu suất của chiến lược, cần tối ưu hóa tham số và kiểm tra lại trong các môi trường thị trường khác nhau để tìm ra sự kết hợp tham số tốt nhất.
- Thị trường sốc: Trong thị trường sốc, giá dao động thường xuyên giữa các đường trung bình dài hạn, có thể dẫn đến chiến lược thường xuyên mở lỗ và mất nhiều chi phí giao dịch.
- Xu hướng biến đổi: Khi xu hướng thị trường biến đổi, chiến lược có thể xảy ra tổn thất liên tục. Tại thời điểm này, cần phải đánh giá sự biến đổi xu hướng kết hợp với các chỉ số hoặc tín hiệu khác để điều chỉnh chiến lược kịp thời.
- Sự kiện Thiên nga đen: Khi thị trường xảy ra sự kiện bất ngờ lớn và không thể dự đoán được, nó có thể dẫn đến biến động mạnh mẽ của giá, gây ra chiến lược sau khi dừng lỗ.
Hướng tối ưu hóa chiến lược
- Xác định xu hướng: Tiến hành thêm các chỉ số định xu hướng trước khi mở vị trí, chẳng hạn như ADX, để xác nhận cường độ và hướng của xu hướng hiện tại và tăng độ chính xác của tín hiệu mở vị trí.
- Hạn chế động lực: Điều chỉnh mức dừng động theo tỷ lệ biến động giá, ATR và các chỉ số khác, nới lỏng lệnh dừng thích hợp khi giá biến động lớn và thắt chặt lệnh dừng khi giá biến động nhỏ.
- Quản lý vị trí: Tùy thuộc vào các yếu tố như cường độ của xu hướng thị trường, tỷ lệ biến động giá, kích thước vị trí được điều chỉnh động mỗi lần mở vị trí, tăng vị trí khi xu hướng mạnh và tỷ lệ biến động trung bình, giảm vị trí khi xu hướng yếu hoặc tỷ lệ biến động quá cao.
- Bảo hiểm đa vùng: Xem xét đồng thời giám sát tín hiệu của cả hai bên đa vùng, bảo hiểm mở vị trí trong các thị trường hoặc chu kỳ khác nhau để giảm rủi ro tổng thể của chiến lược.
Tóm tắt
Chiến lược theo dõi sự đảo ngược của trung bình di chuyển thông qua mối quan hệ vị trí tương đối giữa hai đường trung bình chu kỳ khác nhau, để nắm bắt nhiều cơ hội để giá đảo ngược trong xu hướng tăng. Chiến lược này phù hợp với thị trường xu hướng, có thể thu được lợi nhuận ổn định trong tình huống xu hướng bằng cách đặt các tham số và lỗ hổng thích hợp.
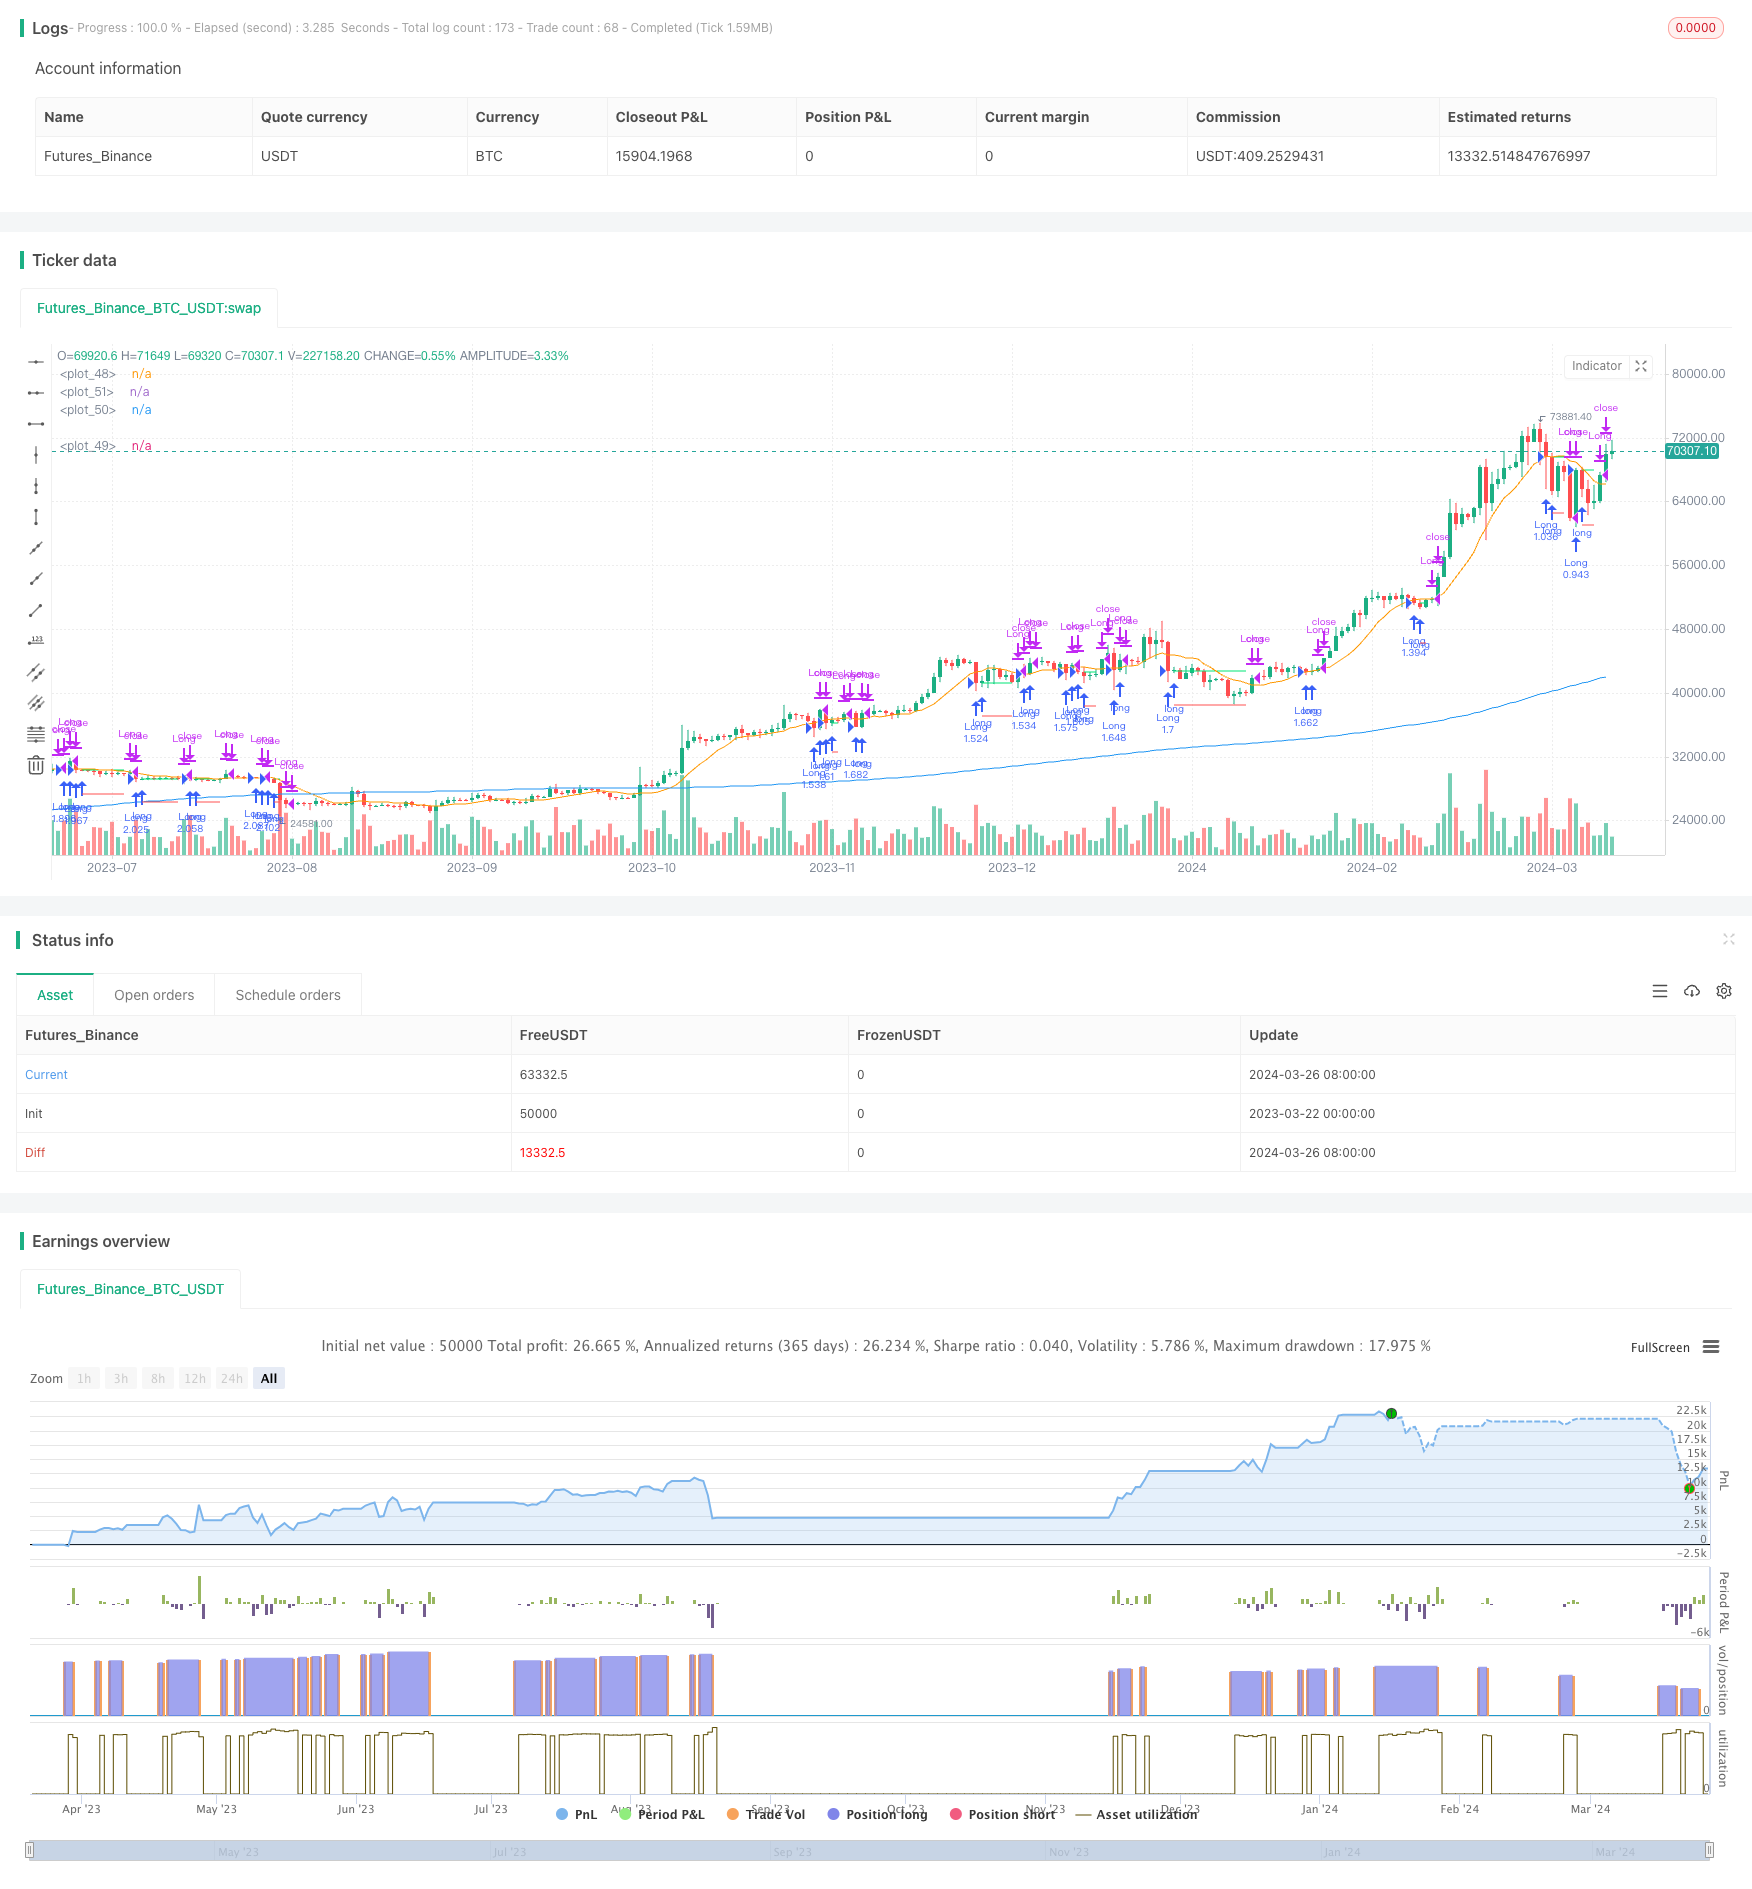
/*backtest
start: 2023-03-22 00:00:00
end: 2024-03-27 00:00:00
period: 1d
basePeriod: 1h
exchanges: [{"eid":"Futures_Binance","currency":"BTC_USDT"}]
*/

// This Pine Script™ code is subject to the terms of the Mozilla Public License 2.0 at https://mozilla.org/MPL/2.0/
// © contapessoal_ivan
// @version=5
strategy("Pullback Strategy",
     overlay=true,
     initial_capital=1000,
     default_qty_type=strategy.percent_of_equity,
     default_qty_value=100, // 100% of balance invested on each trade
     commission_type=strategy.commission.cash_per_contract,
     commission_value=0.005) // Interactive Brokers rate

// Get user input
i_ma1           = input.int(title="MA 1 Length", defval=200, step=10, group="Strategy Parameters", tooltip="Long-term MA")
i_ma2           = input.int(title="MA 2 Length", defval=10, step=10, group="Strategy Parameters", tooltip="Short-term MA")
i_stopPercent   = input.float(title="Stop Loss Percent", defval=0.10, step=0.1, group="Strategy Parameters", tooltip="Failsafe Stop Loss Percent Decline")
i_lowerClose    = input.bool(title="Exit On Lower Close", defval=false, group="Strategy Parameters", tooltip="Wait for a lower-close before exiting above MA2")
i_startTime     = input(title="Start Filter", defval=timestamp("26 Jan 2023 00:00 +0000"), group="Time Filter", tooltip="Start date & time to begin searching for setups")
i_endTime       = input(title="End Filter", defval=timestamp("26 Mar 2024 23:59 +0000"), group="Time Filter", tooltip="End date & time to stop searching for setups")

// Get indicator values
ma1 = ta.sma(close, i_ma1)
ma2 = ta.sma(close, i_ma2)

// Check filter(s)
f_dateFilter = true

// Check buy/sell conditions
var float buyPrice = 0
buyCondition    = close > ma1 and close < ma2 and strategy.position_size == 0 and f_dateFilter
sellCondition   = close > ma2 and strategy.position_size > 0 and (not i_lowerClose or close < low[1])
stopDistance    = strategy.position_size > 0 ? ((buyPrice - close) / close) : na
stopPrice       = strategy.position_size > 0 ? buyPrice - (buyPrice * i_stopPercent) : na
stopCondition   = strategy.position_size > 0 and stopDistance > i_stopPercent

// Enter positions
if buyCondition
    strategy.entry(id="Long", direction=strategy.long)

if buyCondition[1]
    buyPrice := open

// Exit positions
if sellCondition or stopCondition
    strategy.close(id="Long", comment="Exit" + (stopCondition ? "SL=true" : ""))
    buyPrice := na

// Draw pretty colors
plot(buyPrice, color=color.lime, style=plot.style_linebr)
plot(stopPrice, color=color.red, style=plot.style_linebr, offset=-1)
plot(ma1, color=color.blue)
plot(ma2, color=color.orange)