Chiến lược giao dịch định lượng đường trung bình động theo cấp số nhân

Tổng quan
Chiến lược này sử dụng sự giao thoa của hai chỉ số trung bình di chuyển ((EMA) làm tín hiệu mua và bán. Khi EMA ngắn hạn đi từ dưới lên qua EMA dài hạn, nó tạo ra tín hiệu mua; ngược lại, khi EMA ngắn hạn đi từ trên xuống qua EMA dài hạn, nó tạo ra tín hiệu bán. Đồng thời, chiến lược này cũng sẽ xác định xem điểm giao thoa là giá cao nhất hoặc thấp nhất trong 10 chu kỳ giao dịch gần đây nhất để xác định cường độ của xu hướng. Nếu điểm giao thoa là cao nhất, giá sẽ được hiển thị màu xanh lá cây trên nền; nếu giá thấp nhất, nó sẽ được hiển thị màu đỏ. Ngoài ra, chiến lược này cũng sẽ hiển thị giá điểm giao thoa trên biểu đồ.
Nguyên tắc chiến lược
- Tính toán EMA của hai chu kỳ khác nhau, chu kỳ mặc định là 5 và 10.
- Xác định xem hai EMA có giao nhau hay không, nếu EMA ngắn hạn từ dưới lên xuyên qua EMA dài, sẽ tạo ra tín hiệu mua; nếu EMA ngắn hạn từ trên xuống xuyên qua EMA dài, sẽ tạo ra tín hiệu bán.
- Khi tạo ra tín hiệu giao thoa, hãy đánh giá xem điểm giao thoa hiện tại là giá cao nhất hoặc giá thấp nhất trong 10 chu kỳ giao dịch gần đây. Nếu giá cao nhất, thì được coi là xu hướng tăng mạnh; Nếu giá thấp nhất, thì được coi là xu hướng giảm mạnh.
- Nếu có tín hiệu mua và không có vị trí hiện tại, hãy mở thêm lệnh; Nếu có tín hiệu bán và không có vị trí hiện tại, hãy mở lệnh trống.
- Nếu đã có nhiều đơn vị giữ vị trí và EMA ngắn hạn đi qua EMA dài từ trên xuống, thì nhiều đơn vị được bán; Nếu đã có đơn vị giữ vị trí trống và EMA ngắn hạn đi qua EMA dài từ dưới lên, thì đơn vị trống.
Lợi thế chiến lược
- Chỉ số di chuyển trung bình có thể phản ứng nhanh hơn với sự thay đổi giá so với trung bình di chuyển đơn giản, do đó có thể tạo ra tín hiệu giao dịch kịp thời hơn.
- Bằng cách đánh giá xem điểm giao thoa có phải là giá cao nhất hoặc giá thấp nhất gần đây, bạn có thể lọc ra các cơ hội giao dịch có cường độ xu hướng cao hơn để tăng lợi nhuận chiến lược.
- Các điểm giao điểm được đánh dấu trên biểu đồ để cung cấp cho các nhà giao dịch một tài liệu tham khảo giao dịch trực quan hơn.
- Có thể sử dụng một số công cụ khác để tạo ra một hệ thống.
Rủi ro chiến lược
- Tín hiệu được tạo ra bởi các đường EMA có thể bị trì hoãn, dẫn đến việc bỏ lỡ thời gian giao dịch tốt nhất.
- Trong thị trường bất ổn, EMA có thể xảy ra thường xuyên, dẫn đến quá nhiều giao dịch và tăng chi phí giao dịch.
- Chiến lược thiếu các biện pháp dừng lỗ và có thể có nguy cơ rút lui cao hơn nếu đánh giá sai.
Hướng tối ưu hóa chiến lược
- Thêm nhiều chỉ số kỹ thuật, như RSI, MACD, để hỗ trợ xác định cường độ và hướng của xu hướng, cải thiện độ chính xác của tín hiệu.
- Thiết lập các điểm dừng và dừng hợp lý để kiểm soát rủi ro giao dịch đơn.
- Tối ưu hóa các tham số giao dịch, chẳng hạn như chu kỳ EMA, cửa sổ thời gian xác nhận chéo, để cải thiện khả năng thích ứng của chiến lược.
- Kết hợp với các chỉ số tâm trạng thị trường, như VIX, để lọc tín hiệu giao dịch, giảm tín hiệu sai.
- Xem xét thêm các mô-đun quản lý vị thế và quản lý tiền, điều chỉnh động lượng tiền trong mỗi giao dịch, nâng cao hiệu quả sử dụng tiền.
Tóm tắt
Chiến lược này sử dụng đường trung bình di chuyển chỉ số như là logic cốt lõi, đồng thời kết hợp với vị trí tương đối của giá điểm giao điểm trong thời gian gần đây để đánh giá cường độ của xu hướng. Nhìn chung, logic chiến lược rõ ràng, lợi thế rõ ràng, nhưng cũng có một số hạn chế và rủi ro. Bằng cách giới thiệu nhiều chỉ số phán đoán phụ trợ, đặt các biện pháp kiểm soát rủi ro hợp lý, tối ưu hóa các tham số quan trọng, có thể nâng cao hơn nữa sự ổn định và khả năng sinh lợi của chiến lược.
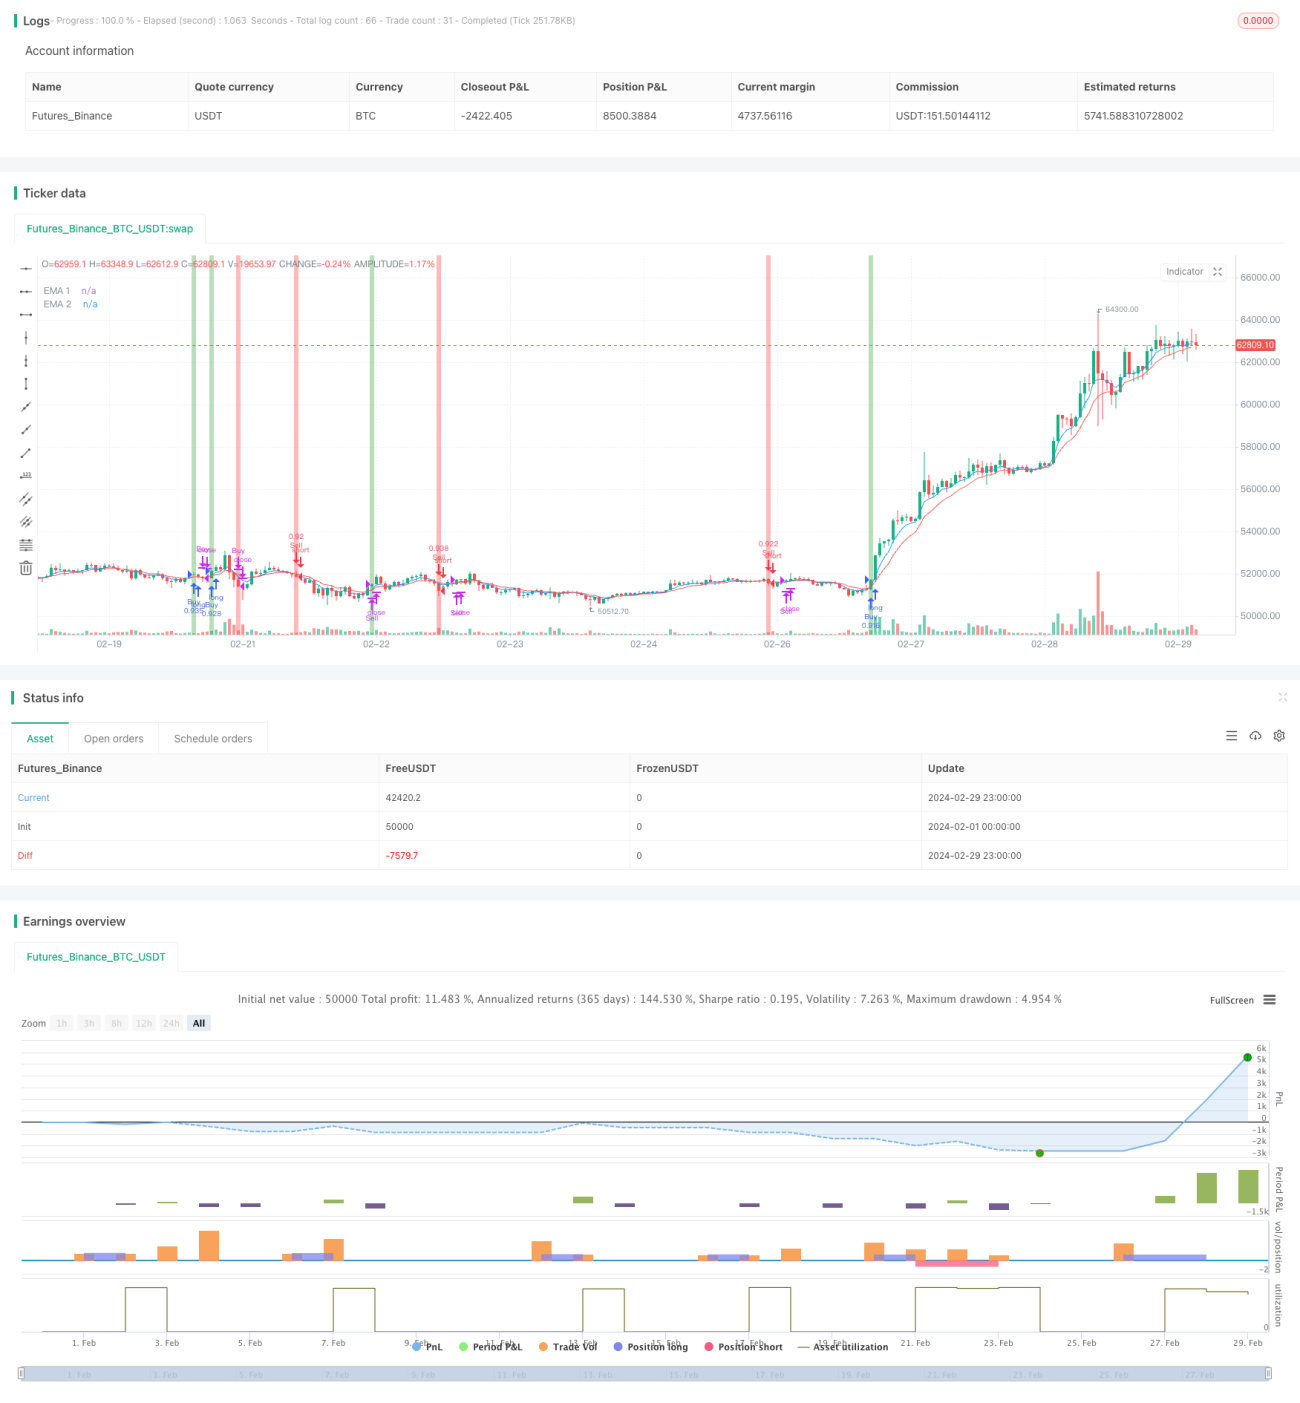
/*backtest
start: 2024-02-01 00:00:00
end: 2024-02-29 23:59:59
period: 1h
basePeriod: 15m
exchanges: [{"eid":"Futures_Binance","currency":"BTC_USDT"}]
*/

// This source code is subject to the terms of the Mozilla Public License 2.0 at https://mozilla.org/MPL/2.0/
// © ZenAndTheArtOfTrading
// @version=5
strategy("ema giao nhau", overlay=true, default_qty_type=strategy.percent_of_equity, default_qty_value=100)- 1