Chiến lược ATR siêu xu hướng

Tổng quan
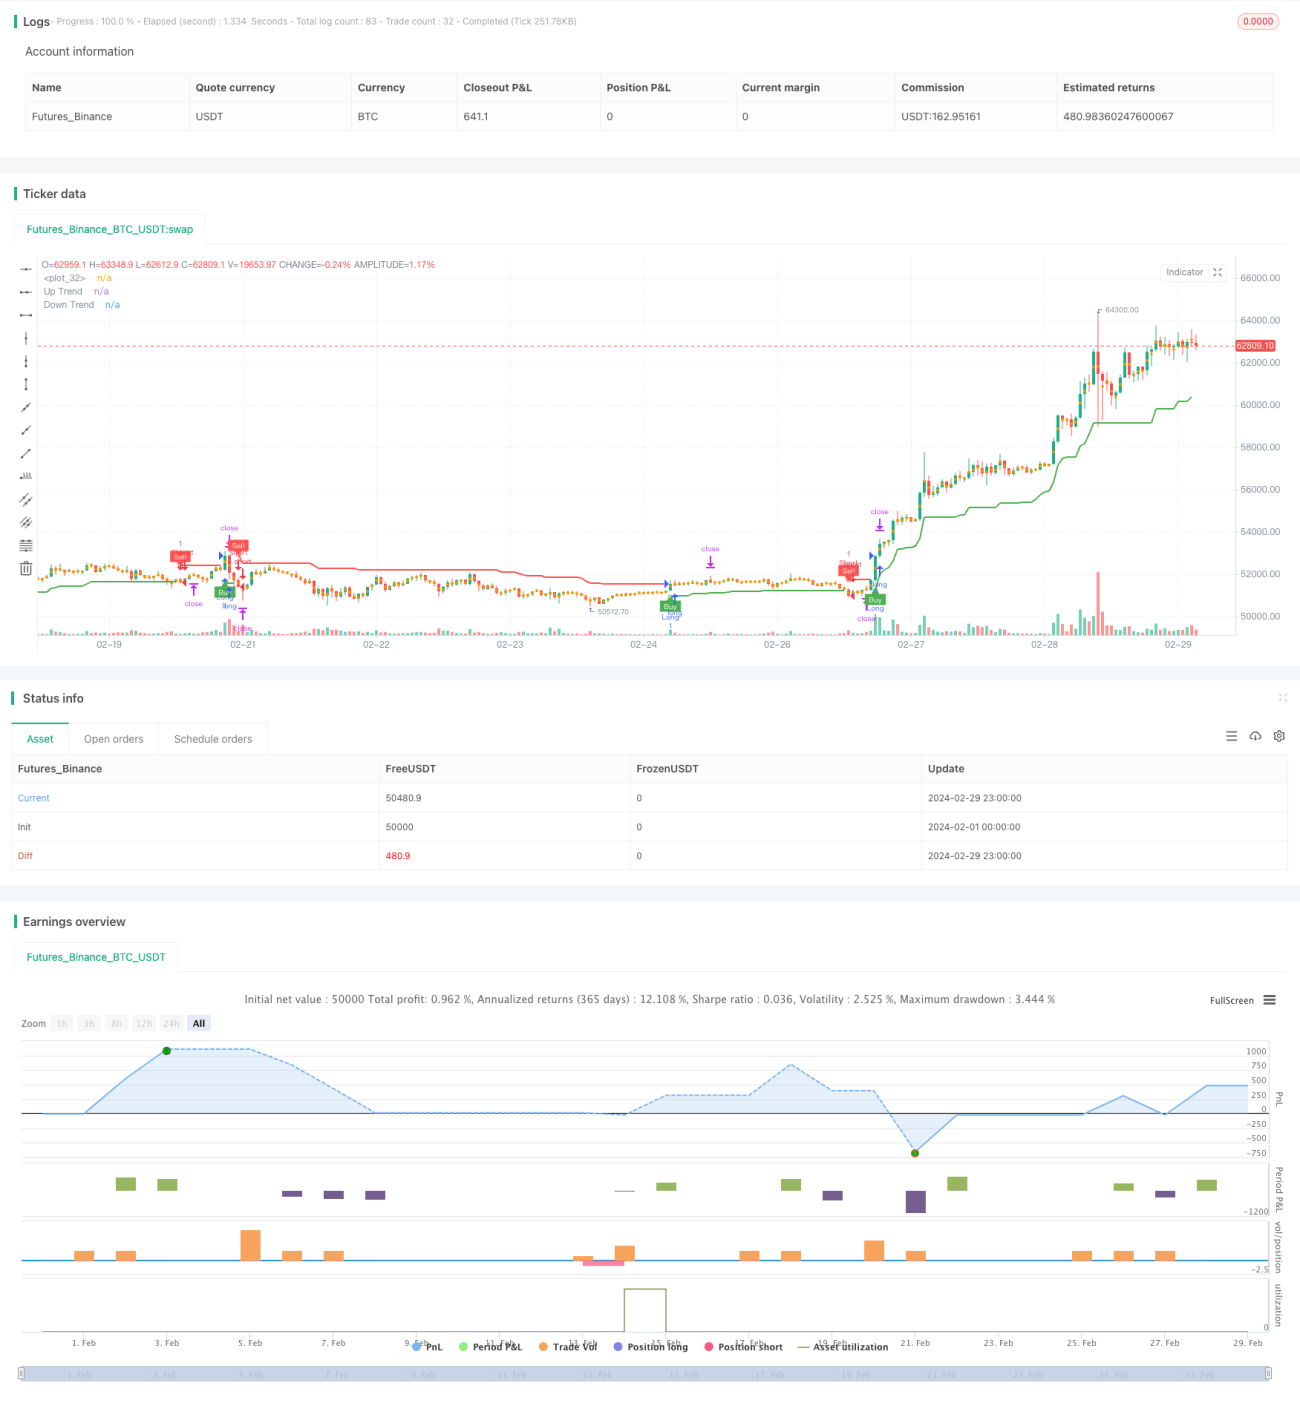
Đây là một chiến lược dựa trên chỉ số siêu xu hướng và chỉ số ATR. Ý tưởng chính của chiến lược này là: Sử dụng chỉ số siêu xu hướng để xác định xu hướng của thị trường hiện tại và giao dịch khi chỉ số siêu xu hướng thay đổi. Đồng thời, chiến lược này sử dụng chỉ số ATR để tính toán giá dừng và giá dừng và tính toán kích thước vị trí dựa trên tỷ lệ nhất định của số dư tài khoản để kiểm soát rủi ro.
Nguyên tắc chiến lược
Các nguyên tắc của chiến lược này là:
- Tính toán giá trị của chỉ số siêu xu hướng, tạo ra tín hiệu mua hoặc bán khi chỉ số siêu xu hướng thay đổi.
- Sử dụng chỉ số ATR để tính toán giá dừng lỗ và giá dừng, giá dừng là giá hiện tại cộng với giá ATR giảm nhân với một nhân số, giá dừng là giá dừng lỗ nhân với tỷ lệ lợi nhuận rủi ro.
- Kích thước vị thế được tính theo tỷ lệ số dư tài khoản và giá dừng lỗ để kiểm soát rủi ro cho mỗi giao dịch.
- Khi tạo ra tín hiệu mua, mở thêm, giá dừng là giá khi tín hiệu được tạo ra trừ ATR nhân với một nhân, giá dừng là giá khi tín hiệu được tạo ra cộng với ATR nhân với một nhân nhân nhân với tỷ lệ lợi nhuận rủi ro.
- Khi tạo ra tín hiệu bán, mở vị trí bằng cách làm trống, giá dừng là giá khi tín hiệu được tạo ra cộng với giá ATR nhân với một nhân số, giá dừng là giá khi tín hiệu được tạo ra trừ giá ATR nhân với một nhân số nhân với tỷ lệ lợi nhuận rủi ro.
Lợi thế chiến lược
Những ưu điểm của chiến lược này là:
- Kết hợp theo dõi xu hướng và chỉ số biến động, có thể nắm bắt được xu hướng hiệu quả, đồng thời kiểm soát rủi ro.
- Kích thước vị trí được tính tự động dựa trên số dư tài khoản và mức độ rủi ro, không cần điều chỉnh thủ công, dễ thực hiện.
- Các tham số có thể được điều chỉnh một cách linh hoạt để phù hợp với các thị trường và giống khác nhau.
Rủi ro chiến lược
Rủi ro của chiến lược này là:
- Trong thị trường bất ổn, các tín hiệu mua và bán thường xuyên có thể dẫn đến chi phí giao dịch cao và điểm trượt.
- Các tỷ lệ dừng và dừng cố định có thể không thích ứng với sự thay đổi của thị trường, dẫn đến dừng quá sớm hoặc lợi nhuận quá nhỏ.
- Tính toán kích thước vị trí phụ thuộc vào biến động lịch sử, và nếu biến động đột ngột, nó có thể dẫn đến rút lui lớn hơn.
Các biện pháp sau đây có thể được áp dụng để đối phó với những rủi ro trên:
- Tăng các điều kiện lọc tín hiệu, giảm tần suất giao dịch.
- Tối ưu hóa phương pháp tính toán dừng và dừng, chẳng hạn như sử dụng dừng di động hoặc dừng động.
- Lập các yếu tố kiểm soát rủi ro trong tính toán vị trí, chẳng hạn như giảm vị trí khi tỷ lệ biến động phá vỡ.
Hướng tối ưu hóa chiến lược
Chiến lược này có thể được tối ưu hóa trong các khía cạnh sau:
- Việc đưa ra nhiều chỉ số kỹ thuật hơn, chẳng hạn như MACD, RSI, v.v., làm điều kiện hỗ trợ cho việc đánh giá xu hướng và lọc tín hiệu, giúp tăng độ chính xác của tín hiệu.
- Tối ưu hóa các tham số của chỉ số siêu xu hướng và chỉ số ATR để tìm ra sự kết hợp tham số tốt nhất cho các thị trường và giống khác nhau.
- Trong tính toán vị trí, giới thiệu nhiều yếu tố kiểm soát rủi ro hơn, chẳng hạn như khoản rút tối đa của tài khoản, rủi ro tối đa của giao dịch đơn lẻ, để cải thiện sự ổn định của chiến lược.
- Thêm các chiến lược dừng lại, chẳng hạn như dừng lại một phần, dừng lại di chuyển, để lợi nhuận tăng lên liên tục.
Các tối ưu hóa trên có thể nâng cao lợi nhuận và tính ổn định của chiến lược, đồng thời giảm rủi ro của chiến lược, giúp chiến lược thích nghi hơn với các môi trường thị trường khác nhau.
Tóm tắt
Chiến lược này kết hợp các chỉ số siêu xu hướng và chỉ số ATR để có thể nắm bắt xu hướng một cách hiệu quả, đồng thời kiểm soát rủi ro. Bằng cách tính toán kích thước vị trí tối ưu, rủi ro cho mỗi giao dịch có thể được kiểm soát. Tuy nhiên, chiến lược này có thể tạo ra chi phí giao dịch và rút lui cao hơn trong thị trường bất ổn.
- 1