Chiến lược kết hợp Super Trend và Bollinger Bands

1
Follow
1781
Followers
Tổng quan
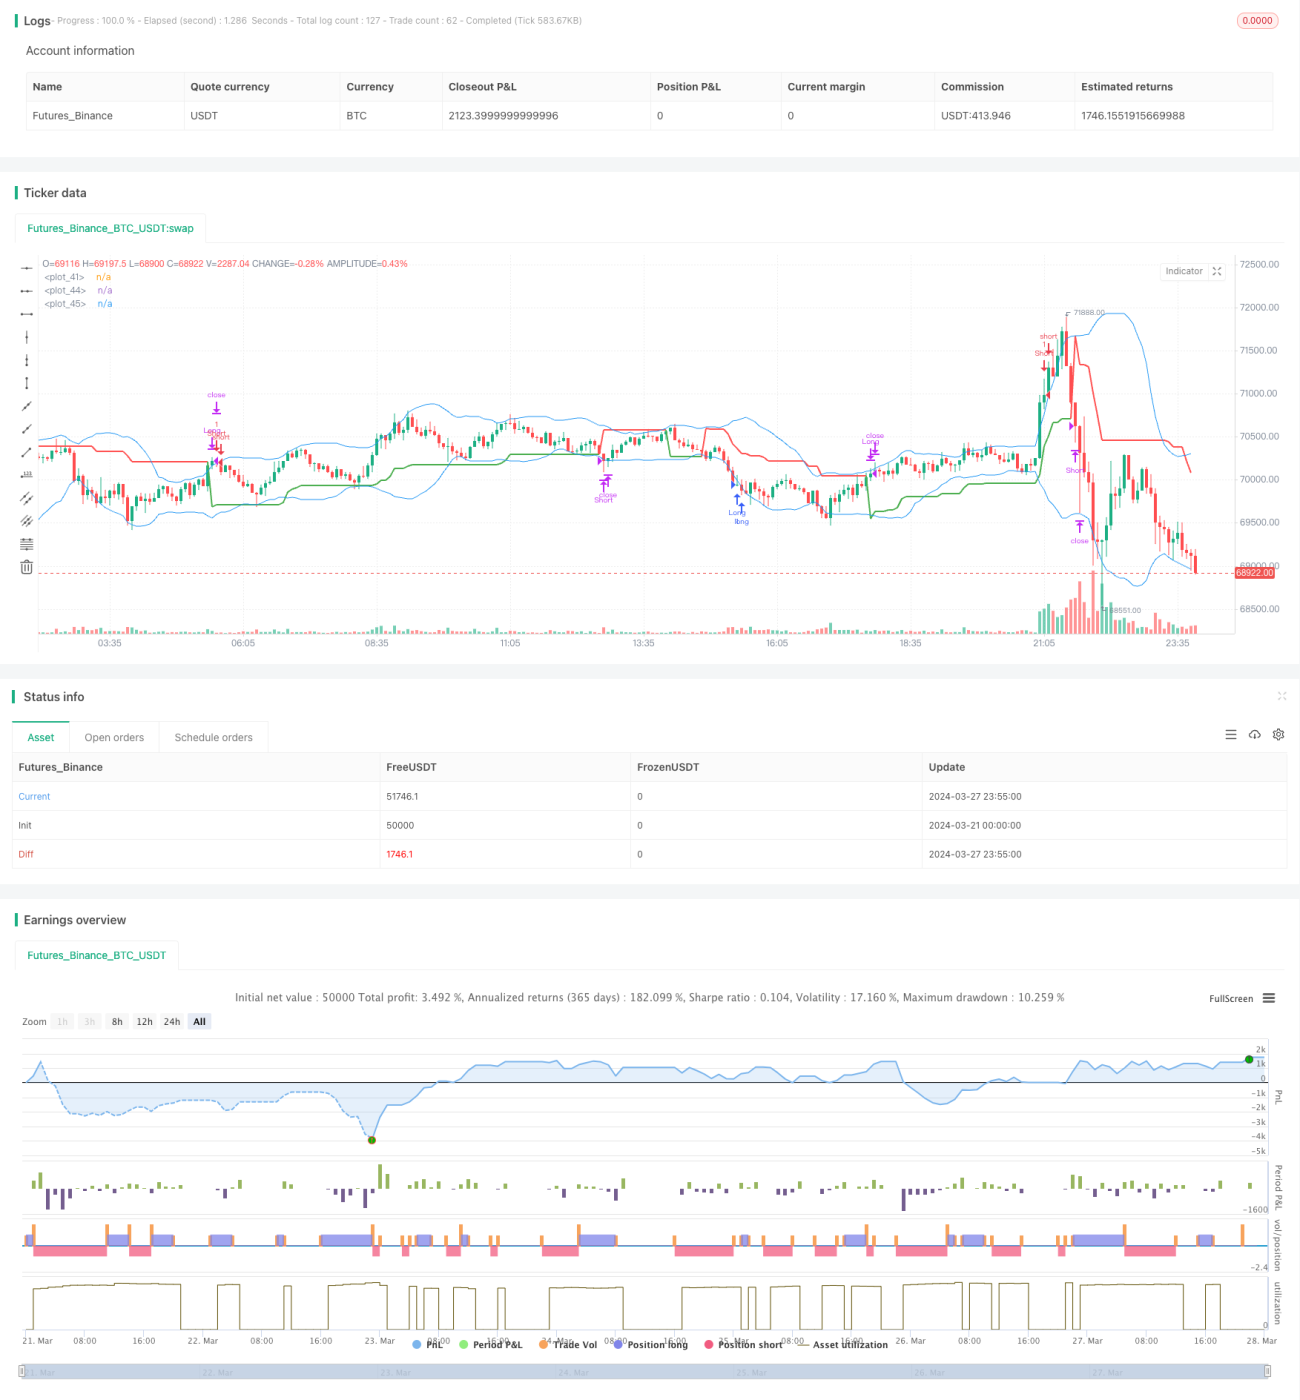
Chiến lược này kết hợp các chỉ số siêu xu hướng và chỉ số Brin để nắm bắt cơ hội xu hướng của thị trường. Chỉ số siêu xu hướng được sử dụng để xác định xu hướng của thị trường hiện tại, trong khi chỉ số Brin được sử dụng để đo lường tỷ lệ biến động của thị trường.
Nguyên tắc chiến lược
- Tính toán real amplitude ((ATR) và chỉ số siêu xu hướng để đánh giá xu hướng của thị trường hiện tại.
- Tính năng này được sử dụng để đo lường sự biến động của thị trường.
- Khi giá đóng cửa phá vỡ đường xu hướng siêu và nằm dưới đường dây Brin, tạo ra tín hiệu nhiều; khi giá đóng cửa rơi xuống đường xu hướng siêu và nằm trên đường dây Brin, tạo ra tín hiệu dừng.
- Khi nắm giữ nhiều vị thế đầu, nếu giá đóng cửa rơi xuống đường xu hướng siêu, thì sẽ bị phá vỡ; khi nắm giữ vị thế đầu trống, nếu giá đóng cửa phá vỡ đường xu hướng siêu thì sẽ bị phá vỡ.
Lợi thế chiến lược
- Kết hợp thông tin về xu hướng và biến động, chúng ta có thể nắm bắt cơ hội thị trường toàn diện hơn.
- Có thể tham gia vào một thời điểm khi xu hướng rõ ràng sẽ giúp nắm bắt lợi ích của xu hướng.
- Trong thị trường chấn động, Brin Belt kết hợp với xu hướng siêu có thể lọc hiệu quả các tín hiệu phá vỡ giả và giảm nguy cơ thua lỗ trong tình huống chấn động.
- Mã logic rõ ràng, ít tham số, dễ hiểu và thực hiện.
Rủi ro chiến lược
- Trong một xu hướng đơn phương, các tín hiệu phá vỡ thường xuyên có thể dẫn đến tần suất giao dịch quá cao, làm tăng chi phí giao dịch.
- Việc nắm bắt điểm đột phá phụ thuộc vào chỉ số siêu xu hướng, trong khi chỉ số này nhạy cảm với các tham số, có thể ảnh hưởng đến hiệu quả của chiến lược.
- Dải băng thông Brin sẽ thay đổi theo biến động của thị trường và có thể mở rộng lệnh dừng trong môi trường biến động cao.
Hướng tối ưu hóa chiến lược
- Có thể xem xét thêm các điều kiện lọc hiệu quả như khối lượng giao dịch, cảm xúc thị trường, v.v. để tăng thêm độ tin cậy của tín hiệu.
- Đối với các tham số của chỉ số siêu xu hướng, có thể thực hiện thử nghiệm tối ưu hóa, chọn tham số tốt nhất để tăng sự ổn định của chiến lược.
- Về thực hiện giao dịch, có thể giới thiệu các biện pháp quản lý vị trí và kiểm soát rủi ro tinh vi hơn, chẳng hạn như thiết lập dừng di động, điều chỉnh vị trí động, v.v., để giảm bớt lỗ hổng rủi ro cho giao dịch đơn lẻ.
Tóm tắt
Chiến lược kết hợp bẫy liên kết siêu xu hướng là một chiến lược theo dõi xu hướng, có thể nắm bắt cơ hội xu hướng một cách hiệu quả hơn bằng cách kết hợp hai yếu tố thị trường xu hướng và biến động. Tuy nhiên, chiến lược này cũng có một số hạn chế, chẳng hạn như nhạy cảm với tham số, tăng rủi ro trong môi trường biến động cao. Do đó, trong ứng dụng thực tế, chiến lược cũng cần được tối ưu hóa và cải tiến thích hợp theo đặc điểm của thị trường và sở thích rủi ro của riêng bạn.
Source
Pine
Strategy parameters
Related strategies
Comment
All comments (0)
No data
- 1