Chiến lược kép RSI và Bollinger Bands

1
Follow
1781
Followers
Tổng quan
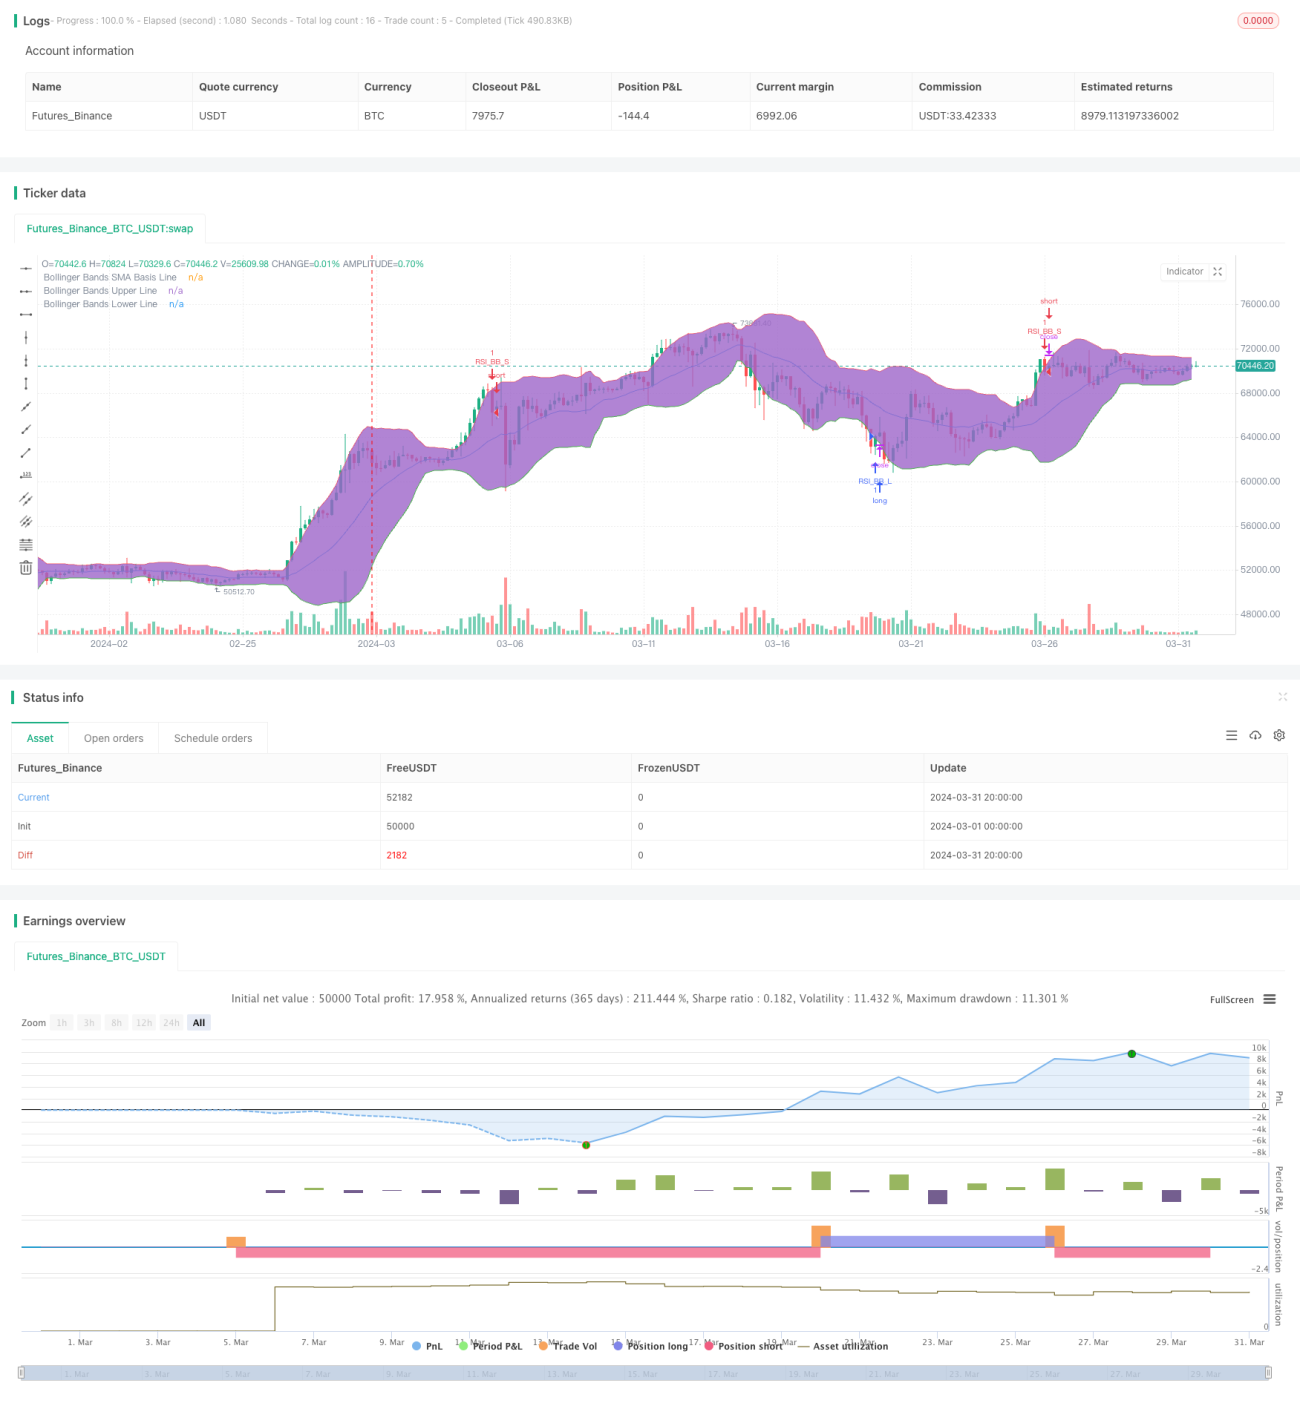
Chiến lược này kết hợp hai chỉ số kỹ thuật tương đối mạnh mẽ (RSI) và Bollinger Bands (Bollinger Bands) để tạo ra tín hiệu mua khi giá thấp hơn Bollinger Bands và bán khi giá cao hơn Bollinger Bands. Chiến lược này chỉ kích hoạt tín hiệu giao dịch khi chỉ số RSI và Bollinger Bands cùng lúc đang bán quá mức hoặc mua quá mức.
Nguyên tắc chiến lược
- Tính RSI dựa trên các tham số RSI đã đặt.
- Sử dụng công thức băng Brin để tính ra đường ray trung tâm, đường ray trên và đường ray dưới của băng Brin.
- Xác định giá đóng cửa hiện tại có phá vỡ đường băng Brin hay không.
- Xác định liệu RSI hiện tại có cao hơn ngưỡng mua quá mức hay thấp hơn ngưỡng bán quá mức không.
- Một tín hiệu giao dịch tương ứng được tạo ra khi cả hai chỉ số Binance và RSI đáp ứng các điều kiện mua hoặc bán.
Lợi thế chiến lược
- Kết hợp hai chỉ số kỹ thuật xu hướng và động lực, nó cho phép đánh giá toàn diện hơn về tình trạng thị trường.
- Việc sử dụng hai chỉ số cùng một lúc như là điều kiện lọc đã làm giảm hiệu quả khả năng xuất hiện của tín hiệu giả.
- Mã logic rõ ràng, tham số thiết lập linh hoạt, phù hợp với môi trường thị trường khác nhau và phong cách giao dịch.
Rủi ro chiến lược
- Trong một thị trường bất ổn, chiến lược này có thể dẫn đến nhiều giao dịch thua lỗ hơn.
- Thiết lập tham số không đúng cách có thể dẫn đến hiệu suất chiến lược kém, cần được tối ưu hóa theo thực tế.
- Chiến lược này không có lệnh dừng lỗ và có thể có nguy cơ rút tiền lớn hơn.
Hướng tối ưu hóa chiến lược
- Các tham số của RSI và BRI có thể được tối ưu hóa dựa trên đặc điểm thị trường và sở thích cá nhân.
- Các chỉ số kỹ thuật khác như MACD, đường trung bình, v.v. được đưa vào để cải thiện độ tin cậy của tín hiệu.
- Thiết lập các điểm dừng và chặn hợp lý, kiểm soát rủi ro giao dịch đơn lẻ.
- Đối với thị trường chấn động, bạn có thể xem xét tăng điều kiện phán đoán hoặc giảm vị trí để giảm chi phí giao dịch thường xuyên.
Tóm tắt
Chiến lược kép RSI và BRI có thể đánh giá toàn diện tình trạng thị trường bằng cách kết hợp các chỉ số xu hướng và động lực và đưa ra tín hiệu giao dịch tương ứng. Tuy nhiên, chiến lược này có thể hoạt động kém trong thị trường bất ổn và không có biện pháp kiểm soát rủi ro, vì vậy cần thận trọng khi sử dụng trên thị trường thực.
Source
Pine
/*backtest
start: 2024-03-01 00:00:00
end: 2024-03-31 23:59:59
period: 4h
basePeriod: 15m
exchanges: [{"eid":"Futures_Binance","currency":"BTC_USDT"}]
*/

//@version=4
strategy("Bollinger + RSI, Double Strategy (by ChartArt) v1.1", shorttitle="CA_-_RSI_Bol_Strat_1.1", overlay=true)

// ChartArt's RSI + Bollinger Bands, Double Strategy - UpdateStrategy parameters
Related strategies
Comment
All comments (0)
No data
- 1