Chiến lược giao cắt MACD

Tổng quan
Chiến lược này sử dụng hai chu kỳ khác nhau của các chỉ số di chuyển trung bình (EMA) để giao chéo, tạo ra một tín hiệu mua khi EMA nhanh từ dưới lên vượt qua EMA chậm, và một tín hiệu bán khi EMA nhanh từ trên xuống vượt qua EMA chậm. Chiến lược này có thể được áp dụng cho một loạt các công cụ tài chính và thời gian, ví dụ như vàng hiệu quả nhất trong chu kỳ 2 giờ, Bitcoin hiệu quả nhất trên biểu đồ đường mặt trời.
Nguyên tắc chiến lược
- Tính toán EMA nhanh ((thời gian mặc định là 12) và EMA chậm ((thời gian mặc định là 26).
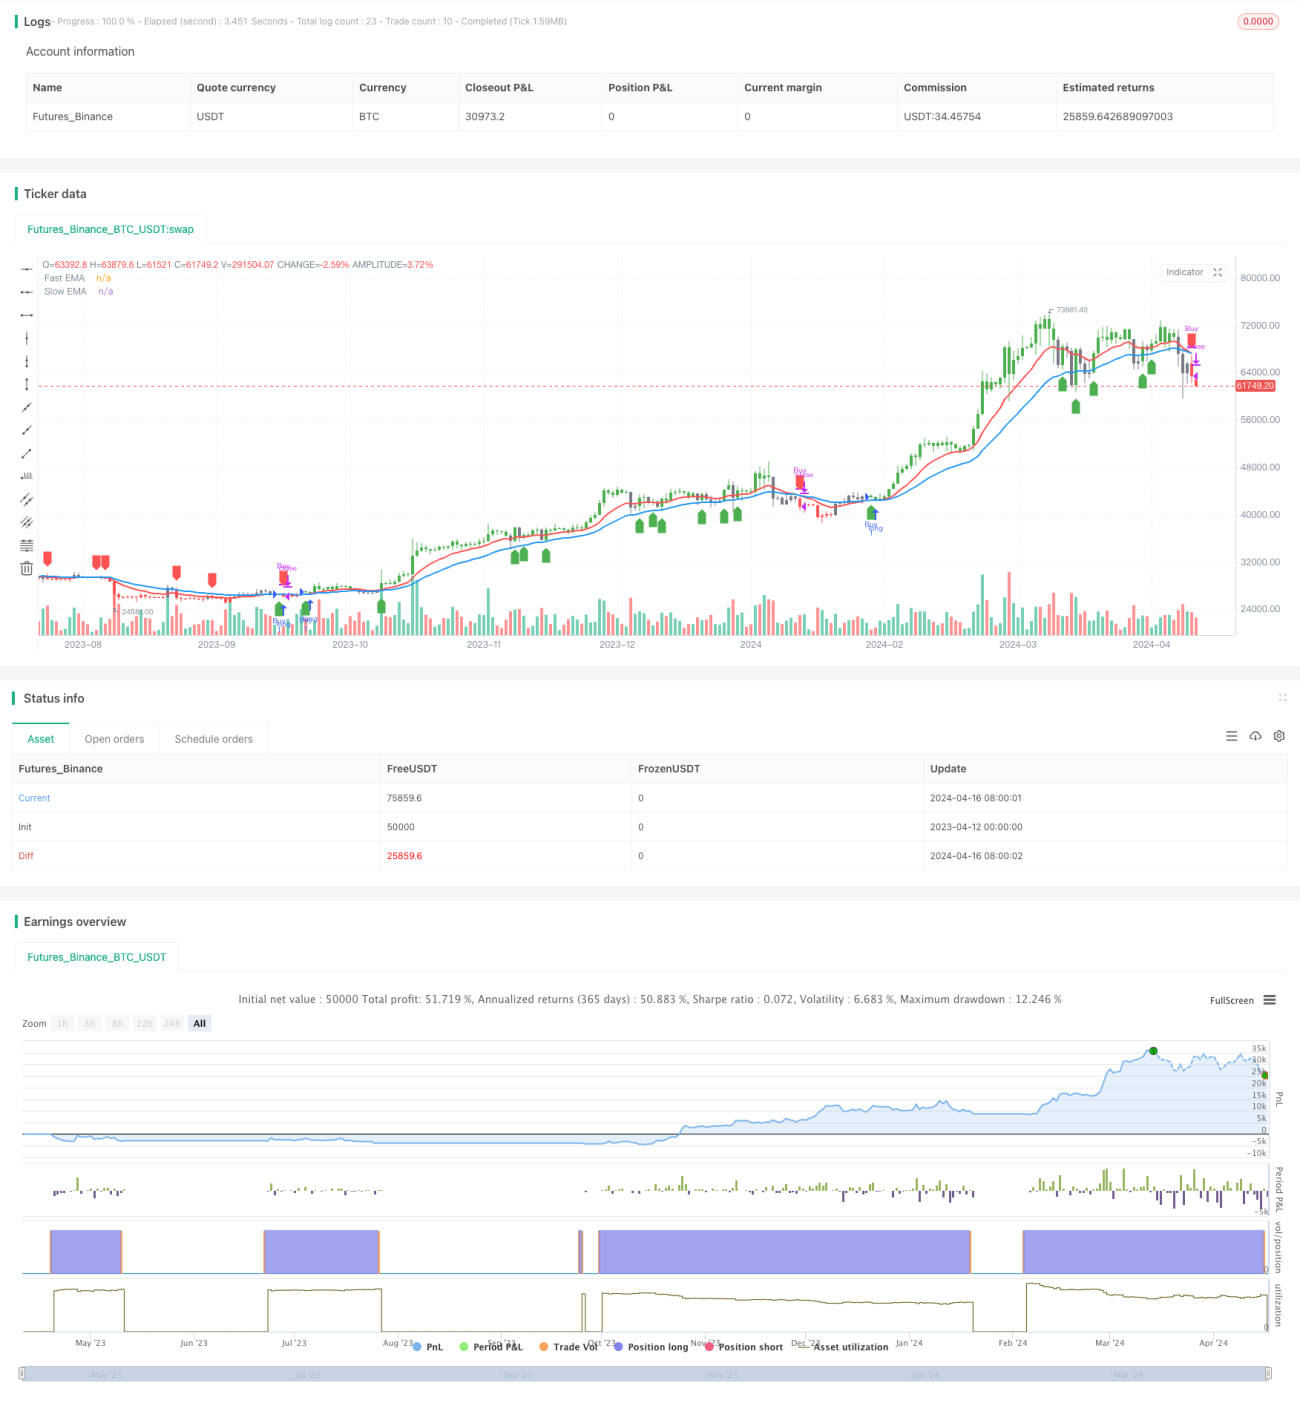
- Xác định khu vực đa đầu ((EMA nhanh nằm trên EMA chậm và giá nằm trên EMA nhanh) và khu vực đầu trống ((EMA nhanh nằm dưới EMA chậm và giá nằm dưới EMA nhanh)).
- Mua khi chuyển từ vùng đầu trống sang vùng đầu nhiều, bán khi chuyển từ vùng đầu nhiều sang vùng đầu trống.
- Các vùng nhiều đầu và vùng trống được đánh dấu bằng màu xanh lá cây và đỏ trên biểu đồ và các tín hiệu mua bán được đánh dấu bằng mũi tên.
Lợi thế chiến lược
- Nó rất đơn giản, dễ hiểu và phù hợp cho người mới bắt đầu.
- Nó có thể được áp dụng cho nhiều loại công cụ tài chính và thời gian.
- Có khả năng theo dõi xu hướng và nắm bắt được xu hướng trung và dài hạn.
- Các tham số có thể được điều chỉnh để tăng tính linh hoạt.
Rủi ro chiến lược
- Trong thị trường chấn động, tín hiệu có thể bị sai và dẫn đến tổn thất.
- Khi xu hướng thay đổi, phản ứng chậm hơn và có thể gây ra điểm trượt.
- Lựa chọn tham số không đúng sẽ ảnh hưởng đến hiệu quả của chiến lược.
Hướng tối ưu hóa chiến lược
- Thêm bộ lọc xu hướng, chẳng hạn như chỉ giao dịch khi ADX lớn hơn một giá trị, giảm tổn thất của thị trường chấn động.
- Tối ưu hóa thời gian ra sân, chẳng hạn như sử dụng ATR để quyết định dừng lỗ, giảm tổn thất đơn lẻ.
- Tối ưu hóa các tham số, tìm ra sự kết hợp tham số tốt nhất, tăng sự ổn định và lợi nhuận.
- Kết hợp với các chỉ số hỗ trợ khác, như MACD, RSI, v.v., để tăng độ chính xác của tín hiệu.
Tóm tắt
Chiến lược giao chéo MACD là một chiến lược đơn giản dựa trên theo dõi xu hướng, ưu điểm là đơn giản, thực tế và có thể áp dụng rộng rãi, nhược điểm là khó nắm bắt xu hướng, lựa chọn tham số khó khăn. Bằng cách lọc xu hướng, tối ưu hóa điểm ra, lựa chọn tham số và kết hợp các chỉ số khác, chiến lược này có thể cải thiện hiệu suất và đáng để nghiên cứu và thử nghiệm thêm.
/*backtest
start: 2023-04-12 00:00:00
end: 2024-04-17 00:00:00
period: 1d
basePeriod: 1h
exchanges: [{"eid":"Futures_Binance","currency":"BTC_USDT"}]
*/

//@version=5
strategy('Advance EMA Crossover Strategy', overlay=true, precision=6)
//****************************************************************************//
// CDC Action Zone is based on a simple EMA crossover - 1