Chiến lược giao dịch lưới phục hồi quá bán chỉ số lớn theo xu hướng sóng

Tổng quan
Chiến lược này dựa trên chỉ số Wavetrend, bằng cách thiết lập nhiều mức bán và mua quá mức, tạo vị trí nhiều đầu khi giá chạm các mức này và kiếm lợi nhuận khi giá bật lên mức mua quá mức. Đây là một chiến lược giao dịch lưới, nhằm mục đích nắm bắt sự phục hồi vượt quá thị trường, áp dụng cho các loại tiền kỹ thuật số như Bitcoin và Solana trong chu kỳ 15 phút.
Nguyên tắc chiến lược
- Tính hai đường của chỉ số Wavetrend, một là giá trị nguyên thủy ((wt1)) và một là giá trị mịn ((wt2)).
- Thiết lập nhiều mức bán tháo (oslevel1 ~ 8) và mức mua tháo (Oblevel1 ~ 5)
- Khi wt1 và wt2 cùng lúc ở dưới một mức bán tháo nhất định, và wt1 ở trên wt2, mở nhiều vị trí đầu. Càng thấp cấp độ, mở vị trí càng quyết liệt hơn.
- Khi wt1 và wt2 cùng lúc cao hơn mức mua quá mức 1 và wt1 dưới wt2, xóa 70% vị trí đa đầu.
- Lặp lại các bước 3 và 4 để tạo ra một hệ thống giao dịch lưới.
Lợi thế chiến lược
- Lấy một sự phục hồi vượt mức giá: Lấy lợi nhuận từ sự phục hồi bằng cách thiết lập nhiều mức bán tháo, mở vị trí sau khi giá giảm mạnh.
- Xây dựng kho hàng loạt, kiểm soát rủi ro: Xây dựng kho hàng loạt theo cấp độ bán tháo, mức thấp hơn thì trọng lượng của kho càng lớn, có thể kiểm soát rủi ro tốt hơn.
- Tự động dừng: Tự động xóa hầu hết các vị trí khi giá tăng trở lại khu vực mua quá mức, khóa lợi nhuận
- Các tham số linh hoạt: Mức độ bán quá mức và mua quá mức có thể được điều chỉnh theo đặc điểm thị trường và sở thích cá nhân, thích nghi với các loại giao dịch và chu kỳ khác nhau.
Rủi ro chiến lược
- Rủi ro sụp đổ: Nếu giá tiếp tục giảm, nó có thể gây ra các tín hiệu mở bán quá mức, có thể dẫn đến việc đóng các vị trí trọng.
- Rủi ro thị trường rung động: Nếu giá liên tục rung động trong khu vực bán tháo, có thể dẫn đến việc mở nhiều lần và không thể dừng lại, do đó làm suy yếu hiệu quả chiến lược.
- Rủi ro tham số: Cài đặt tham số khác nhau có ảnh hưởng lớn đến hiệu suất chiến lược, cần tối ưu hóa dựa trên phản hồi và kinh nghiệm, nếu không có thể gây thiệt hại.
Hướng tối ưu hóa chiến lược
- Thêm bộ lọc xu hướng: Trước khi mở vị trí, hãy đánh giá xu hướng lớn có tăng hay không và tránh mở vị trí trong xu hướng giảm.
- Quản lý vị trí tối ưu hóa: Điều chỉnh kích thước vị trí mở theo khoảng cách từ mức bán tháo.
- Động lực dừng: Động lực điều chỉnh mức dừng dựa trên tỷ lệ lợi nhuận của vị trí, thay vì tỷ lệ cố định.
- Thêm dừng: thiết lập dừng cố định hoặc theo dõi, kiểm soát tổn thất tối đa cho mỗi giao dịch.
Tóm tắt
Chiến lược giao dịch lưới phản hồi của Wavetrend là một chiến lược định lượng dựa trên tín hiệu mua bán quá mức, cố gắng nắm bắt tình hình phản hồi sau khi vượt quá mức giá, lấy lợi nhuận từ chênh lệch giá bằng cách xây dựng vị trí và dừng tự động. Ưu điểm của chiến lược này là khả năng thích ứng mạnh mẽ, có thể điều chỉnh tham số một cách linh hoạt, nhưng cũng có nguy cơ tiếp tục giảm thị trường, thiết lập tham số không đúng cách.
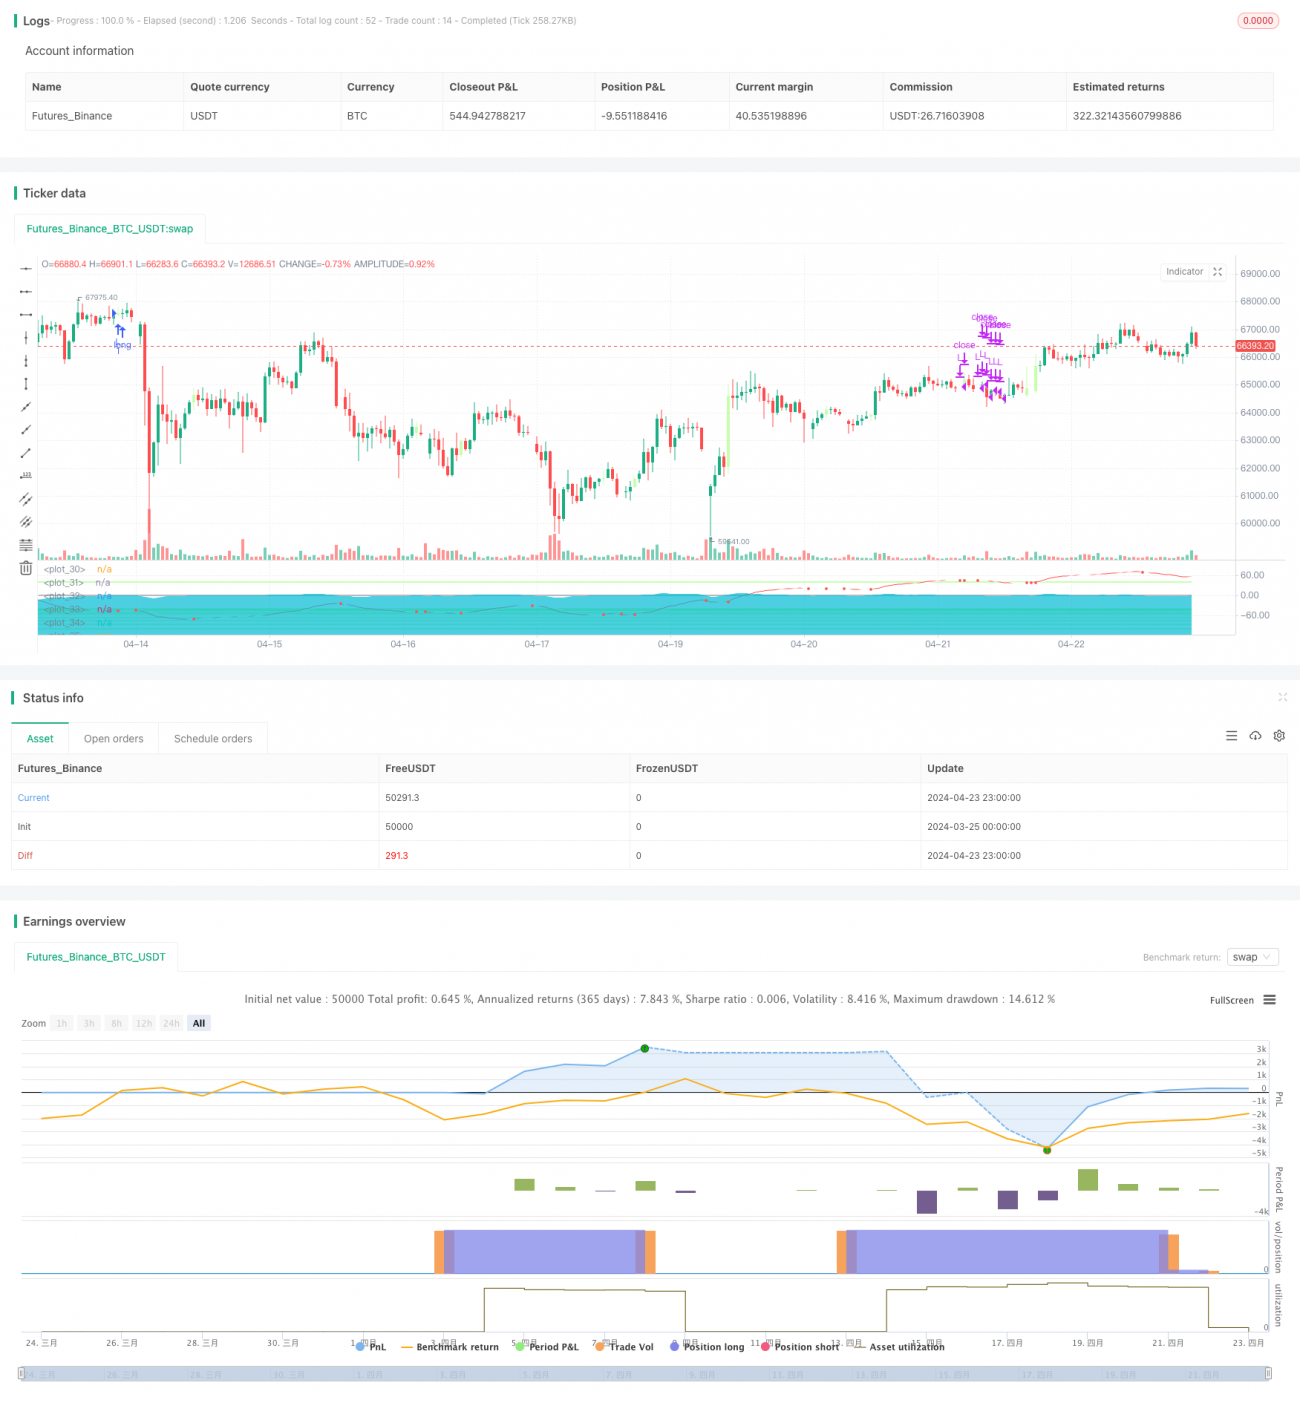
/*backtest
start: 2024-03-25 00:00:00
end: 2024-04-24 00:00:00
period: 1h
basePeriod: 15m
exchanges: [{"eid":"Futures_Binance","currency":"BTC_USDT"}]
*/

//@version=5
// © And Isaac, all rights reserved. If there is any piracy, please call the police immediately.

strategy(title='wavetrend',shorttitle='DCA-High win rate quantitative trading')- 1