Chiến lược lợi nhuận nhiều lớp giao cắt đường trung bình động

Tổng quan
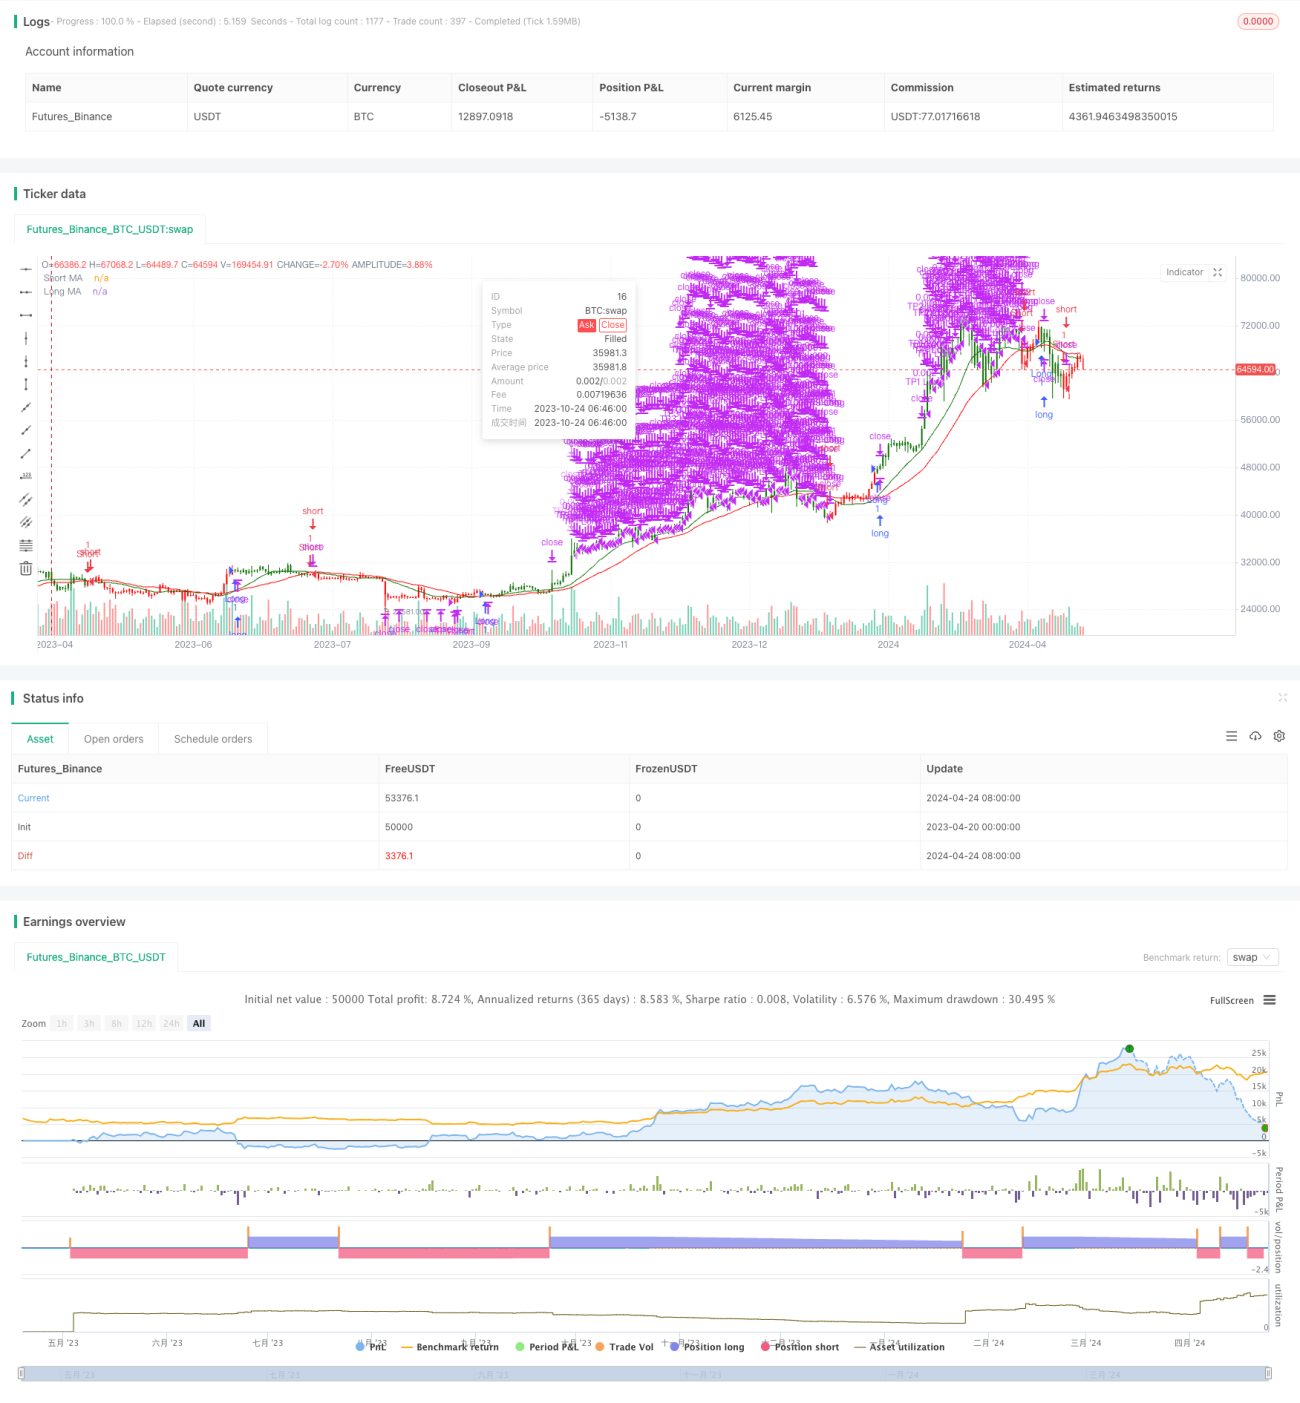
Chiến lược này sử dụng sự giao thoa của hai đường trung bình di chuyển để đánh giá xu hướng thị trường, mở nhiều vị trí khi đường trung bình di chuyển ngắn hạn đi qua đường trung bình di chuyển dài hạn, và ngược lại, mở các vị trí trống. Đồng thời, chiến lược này sử dụng nhiều cấp độ lợi nhuận kết thúc, khi giá đạt đến mức lợi nhuận dự kiến, giải quyết hàng loạt các vị trí, để tối đa hóa lợi nhuận và kiểm soát rủi ro.
Nguyên tắc chiến lược
Cốt lõi của chiến lược này là sử dụng trung bình di chuyển trong các chu kỳ khác nhau để nắm bắt xu hướng thị trường. Khi trung bình di chuyển ngắn hạn đi qua trung bình di chuyển dài hạn, có nghĩa là thị trường có thể đi vào xu hướng tăng, trong khi mở nhiều vị trí; Khi trung bình di chuyển ngắn hạn đi qua trung bình di chuyển dài hạn, có nghĩa là thị trường có thể đi vào xu hướng giảm, trong khi mở các vị trí trống. Đồng thời, chiến lược này đặt ra nhiều mức lợi nhuận, và khi giá đạt đến các mức này, cân bằng các vị trí theo tỷ lệ dự kiến, do đó có thể thu được nhiều lợi nhuận hơn khi xu hướng tiếp tục, đồng thời kiểm soát rủi ro.
Lợi thế chiến lược
- Đơn giản và hiệu quả: Chiến lược này dựa trên nguyên tắc chéo trung bình di chuyển cổ điển, đơn giản và dễ hiểu, đồng thời đã chứng minh hiệu quả của nó trong thực tế.
- Kết thúc lợi nhuận đa cấp: Bằng cách thiết lập nhiều mức lợi nhuận và phá vỡ hàng loạt khi giá đạt đến các mức này, bạn có thể tối đa hóa lợi nhuận và kiểm soát rủi ro.
- Tính linh hoạt về tham số: Các tham số của chiến lược này được thiết lập rất linh hoạt, người dùng có thể điều chỉnh chu kỳ trung bình di chuyển và mức lợi nhuận để đạt được hiệu quả tối ưu theo nhu cầu và đặc điểm thị trường của họ.
Rủi ro chiến lược
- Rủi ro biến động thị trường: Khi thị trường biến động mạnh, các tín hiệu giao thoa thường xuyên có thể dẫn đến chiến lược giao dịch thường xuyên, làm tăng chi phí giao dịch và rủi ro rút lui.
- Rủi ro đặt tham số: Thiết lập tham số không phù hợp có thể dẫn đến hiệu suất chiến lược kém, chẳng hạn như chọn không đúng chu kỳ trung bình di chuyển hoặc thiết lập mức lợi nhuận không hợp lý.
- Rủi ro nhận diện xu hướng: Chiến lược này phụ thuộc nhiều vào xu hướng, có thể có nhiều tín hiệu giả tạo khi thị trường bị dao động hoặc xu hướng không rõ ràng, dẫn đến tổn thất.
Hướng tối ưu hóa chiến lược
- Kết hợp với các chỉ số khác: Bạn có thể xem xét kết hợp với các chỉ số kỹ thuật khác, chẳng hạn như RSI, MACD, v.v., để tăng độ chính xác và độ tin cậy trong nhận dạng xu hướng.
- Các tham số tối ưu hóa: có thể tìm kiếm chu kỳ trung bình di chuyển và tham số mức lợi nhuận tối ưu nhất để thích ứng với các điều kiện thị trường khác nhau thông qua phản hồi và tối ưu hóa.
- Thêm dừng: Bạn có thể xem xét thêm cơ chế dừng để kiểm soát rủi ro hơn nữa, chẳng hạn như dừng động theo cài đặt ATR.
- Thay đổi vào và ra sân: Có thể khám phá thêm các điều kiện vào và ra sân, như xem xét các yếu tố như khối lượng giao dịch, kháng cự hỗ trợ, để cải thiện sự ổn định của chiến lược.
Tóm tắt
Chiến lược lợi nhuận đa tầng chéo trung bình di chuyển là một chiến lược theo dõi xu hướng đơn giản và hiệu quả, có thể thu được nhiều lợi nhuận hơn trong xu hướng bằng cách kết thúc lợi nhuận đa tầng, đồng thời kiểm soát rủi ro. Tuy nhiên, chiến lược này cũng có một số hạn chế và rủi ro, cần được tối ưu hóa và cải thiện theo tình trạng thị trường cụ thể và nhu cầu của người dùng.
/*backtest
start: 2023-04-20 00:00:00
end: 2024-04-25 00:00:00
period: 1d
basePeriod: 1h
exchanges: [{"eid":"Futures_Binance","currency":"BTC_USDT"}]
*/

// This Pine Script™ code is subject to the terms of the Mozilla Public License 2.0 at https://mozilla.org/MPL/2.0/
// © ValdesTradingBots

//Follow Us for More Insights and Updates!- 1