Chiến lược định lượng tín hiệu RSI và Double EMA Crossover

Tổng quan
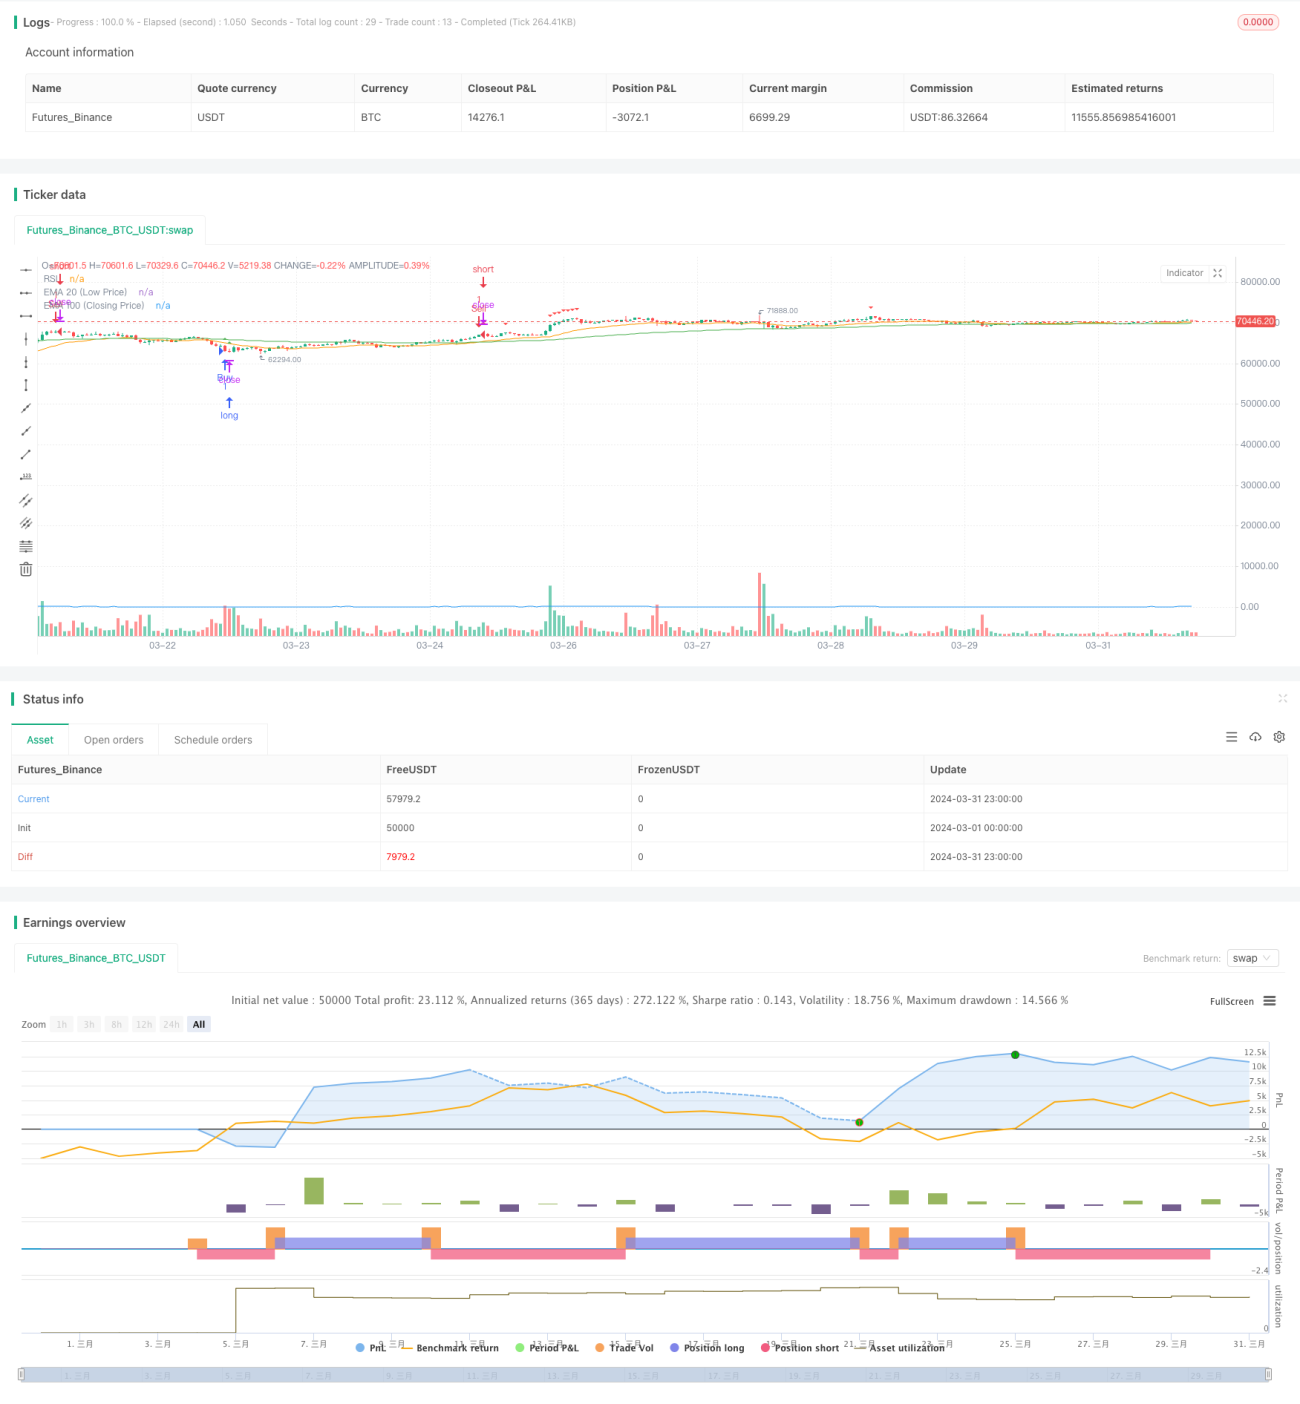
Chiến lược này dựa trên chỉ số RSI và tín hiệu giao nhau của hai đường EMA để xác định điểm mua và bán. Nó tạo ra tín hiệu mua khi giá đóng cửa giảm xuống dưới EMA100 và EMA20 và giá RSI thấp hơn 30; nó tạo ra tín hiệu bán khi giá đóng cửa phá vỡ EMA100 và EMA20 và giá RSI cao hơn 70. Ý tưởng chính của chiến lược này là sử dụng chỉ số RSI để xác định tình trạng mua quá mức, kết hợp với phán đoán xu hướng của đường EMA, để nắm bắt mức thấp và cao của thị trường để thực hiện hoạt động giảm giá.
Nguyên tắc chiến lược
- Tính RSI được sử dụng để đánh giá thị trường đang mua quá mức. RSI dưới 30 được coi là bán quá mức và trên 70 là mua quá mức.
- Hai đường trung bình EMA100 cho giá đóng cửa và EMA20 cho giá thấp nhất được sử dụng để đánh giá xu hướng.
- Khi giá đóng cửa giảm xuống dưới EMA100 và EMA20 và RSI dưới 30, nó được coi là bán quá mức và xu hướng đi xuống, tạo ra tín hiệu mua.
- Khi giá đóng cửa vượt qua EMA100 và EMA20 và giá trị RSI cao hơn 70, nó được đánh giá là quá mua và có xu hướng đi lên, tạo ra tín hiệu bán.
- Mua nhiều khi tín hiệu được kích hoạt và bán khi tín hiệu được kích hoạt.
Phân tích lợi thế
- Kết hợp chỉ số RSI với đường trung bình EMA sẽ giúp bạn đánh giá tốt hơn các điểm thay đổi xu hướng và thời gian mua quá mức, giảm tín hiệu sai.
- Các tham số có thể điều chỉnh, có thể được tối ưu hóa theo các tiêu chuẩn và chu kỳ khác nhau, có khả năng thích ứng và linh hoạt.
- Logic đơn giản, rõ ràng, dễ hiểu và thực hiện, không cần nhiều cơ sở phân tích kỹ thuật.
- Nó có thể được sử dụng trong các biến động thị trường, có thể nắm bắt các điểm cao và thấp của biến động, và có thể thu được lợi nhuận từ chênh lệch giá.
Phân tích rủi ro
- Đối với xu hướng một chiều có thể không hiệu quả, sau khi xu hướng hình thành, nó sẽ liên tục tạo ra tín hiệu sai và bị che đậy.
- Các tham số cố định, thiếu khả năng thích ứng với thị trường động, dễ bị ảnh hưởng bởi sự thay đổi nhịp độ thị trường.
- Giao dịch thường xuyên trong thời gian bất ổn có thể tạo ra điểm trượt và phí xử lý lớn, ảnh hưởng đến lợi nhuận chiến lược.
- Thiếu quản lý vị trí và các biện pháp kiểm soát rủi ro, rút tiền và mất mát tối đa không thể kiểm soát được.
Hướng tối ưu hóa
- Tham gia vào các điều kiện phán đoán xu hướng, chẳng hạn như vượt qua MA, DMI, v.v., để tránh bị đặt trong xu hướng một chiều.
- Tối ưu hóa các tham số của RSI và EMA để tìm các tham số phù hợp nhất với tiêu chuẩn và chu kỳ, cải thiện độ chính xác của tín hiệu.
- Giới thiệu mô hình quản lý vị trí, chẳng hạn như vị trí ATR hoặc công thức Kelly, để kiểm soát tỷ lệ tiền trên mỗi giao dịch, giảm rủi ro.
- Thiết lập các điều kiện dừng lỗ và dừng, chẳng hạn như dừng phần trăm cố định hoặc dừng di chuyển, để kiểm soát tổn thất tối đa và lợi nhuận quay trở lại trong một giao dịch.
- Kết hợp với các chỉ số hỗ trợ khác như MACD, Brin, v.v., tăng khả năng xác nhận tín hiệu và giảm sai lầm.
Tóm tắt
Chiến lược định lượng tín hiệu chéo RSI và EMA kép là một chiến lược giao dịch định lượng đơn giản và thực tế, có thể nắm bắt tốt hơn các điểm cao và thấp trong tình trạng biến động bằng cách kết hợp chỉ số RSI với đường trung bình EMA, để đặt giá chênh lệch. Tuy nhiên, chiến lược này cũng có một số hạn chế và rủi ro, chẳng hạn như không hiệu quả trong tình trạng xu hướng, thiếu các biện pháp quản lý vị trí và kiểm soát rủi ro. Do đó, trong ứng dụng thực tế, cần phải tối ưu hóa và cải tiến thích hợp theo đặc điểm của thị trường và sở thích cá nhân để tăng cường sự ổn định và khả năng lợi nhuận của chiến lược.
- 1