Chiến lược theo dõi xu hướng đa chỉ báo

Tổng quan
Chiến lược này được gọi là "Jancok Strategycs v3", một chiến lược theo dõi xu hướng đa chỉ số dựa trên đường trung bình di chuyển (MA), đường trung bình di chuyển (MACD), chỉ số tương đối mạnh (RSI) và phạm vi thực trung bình (ATR). Ý tưởng chính của chiến lược này là sử dụng sự kết hợp của nhiều chỉ số để đánh giá xu hướng thị trường và giao dịch theo hướng xu hướng.
Nguyên tắc chiến lược
Chiến lược này sử dụng bốn chỉ số sau để đánh giá xu hướng thị trường:
- Trung bình di chuyển ((MA): tính toán trung bình di chuyển ngắn hạn ((9 chu kỳ) và dài hạn ((21 chu kỳ), khi đường trung bình ngắn hạn đi qua đường trung bình dài hạn, cho thấy xu hướng tăng; khi đường trung bình ngắn hạn đi qua đường trung bình dài hạn, cho thấy xu hướng giảm.
- Mạng trung bình di chuyển (MACD): tính toán đường MACD và đường tín hiệu, khi MACD đi qua đường tín hiệu, cho thấy xu hướng tăng; khi MACD đi qua đường tín hiệu, cho thấy xu hướng giảm.
- Chỉ số tương đối yếu ((RSI): RSI được tính trong 14 chu kỳ, khi RSI lớn hơn 70, thị trường có thể mua quá mức; khi RSI nhỏ hơn 30, thị trường có thể bán quá mức.
- Phạm vi trung bình thực tế ((ATR): ATR được tính trong 14 chu kỳ, được sử dụng để đo lường sự biến động của thị trường và thiết lập điểm dừng lỗ.
Chiến lược này có tính toán giao dịch như sau:
- Khi đường trung bình ngắn hạn đi qua đường trung bình dài hạn, đường MACD đi qua đường tín hiệu, khối lượng giao dịch lớn hơn trung bình di chuyển của nó và tỷ lệ biến động thấp hơn ngưỡng, hãy mở lệnh.
- Khi đường trung bình ngắn hạn xuyên qua đường trung bình dài hạn, đường MACD xuyên qua đường tín hiệu, khối lượng giao dịch lớn hơn trung bình di chuyển của nó và tỷ lệ dao động thấp hơn ngưỡng, mở thẻ trống.
- Hạn chế và dừng điểm theo thiết lập động ATR, dừng điểm là 2 lần ATR và dừng điểm là 4 lần ATR.
- Có thể sử dụng tracking stop loss dựa trên ATR, tracking stop loss point là 2,5 lần ATR.
Lợi thế chiến lược
- Kết hợp nhiều chỉ số để đánh giá xu hướng, tăng độ chính xác của đánh giá xu hướng.
- Động thái dừng lỗ và dừng lại, điều chỉnh theo biến động của thị trường, kiểm soát tốt hơn rủi ro và tối ưu hóa lợi nhuận.
- Tiếp tục giới thiệu bộ lọc khối lượng giao dịch và tỷ lệ biến động để tránh giao dịch trong thời gian có tính thanh khoản thấp và biến động cao, giảm tín hiệu giả.
- Có thể chọn theo dõi dừng lỗ để giữ thêm lợi nhuận khi xu hướng tiếp tục.
Rủi ro chiến lược
- Trong một thị trường chấn động hoặc một xu hướng đảo ngược, có thể tạo ra tín hiệu sai, dẫn đến tổn thất.
- Cài đặt tham số có ảnh hưởng lớn đến hiệu suất chiến lược và cần được tối ưu hóa cho các thị trường và tài sản khác nhau.
- Các tham số được tối ưu hóa quá mức có thể dẫn đến quá phù hợp và không hoạt động tốt trong giao dịch thực tế.
- Chiến lược này có thể chịu tổn thất lớn hơn khi thị trường biến động bất thường hoặc xảy ra sự kiện thiên nga đen.
Hướng tối ưu hóa chiến lược
- Việc đưa ra nhiều chỉ số hơn, chẳng hạn như các chỉ số Brin và chỉ số ngẫu nhiên, sẽ giúp tăng cường tính chính xác của xu hướng.
- Lựa chọn tham số tối ưu hóa, sử dụng thuật toán di truyền, tìm kiếm lưới và các phương pháp khác để tìm ra sự kết hợp tham số tối ưu.
- Cài đặt các tham số và quy tắc khác nhau cho các thị trường và tài sản khác nhau, nâng cao khả năng thích ứng của chiến lược.
- Tham gia quản lý vị trí, động điều chỉnh kích thước vị trí tùy theo cường độ của xu hướng thị trường và rủi ro tài khoản.
- Thiết lập giới hạn rút tối đa, tạm dừng giao dịch hoặc giảm vị trí khi tài khoản đạt mức rút tối đa, kiểm soát rủi ro.
Tóm tắt
"Jancok Strategycs v3" là một chiến lược theo dõi xu hướng dựa trên nhiều chỉ số kết hợp để đánh giá xu hướng thị trường thông qua các chỉ số như moving average, MACD, RSI và ATR, và sử dụng các phương tiện quản lý rủi ro như dừng lỗ động và theo dõi dừng lỗ để kiểm soát rủi ro và tối ưu hóa lợi nhuận. Ưu điểm của chiến lược này là tính chính xác trong đánh giá xu hướng, quản lý rủi ro linh hoạt và thích ứng.
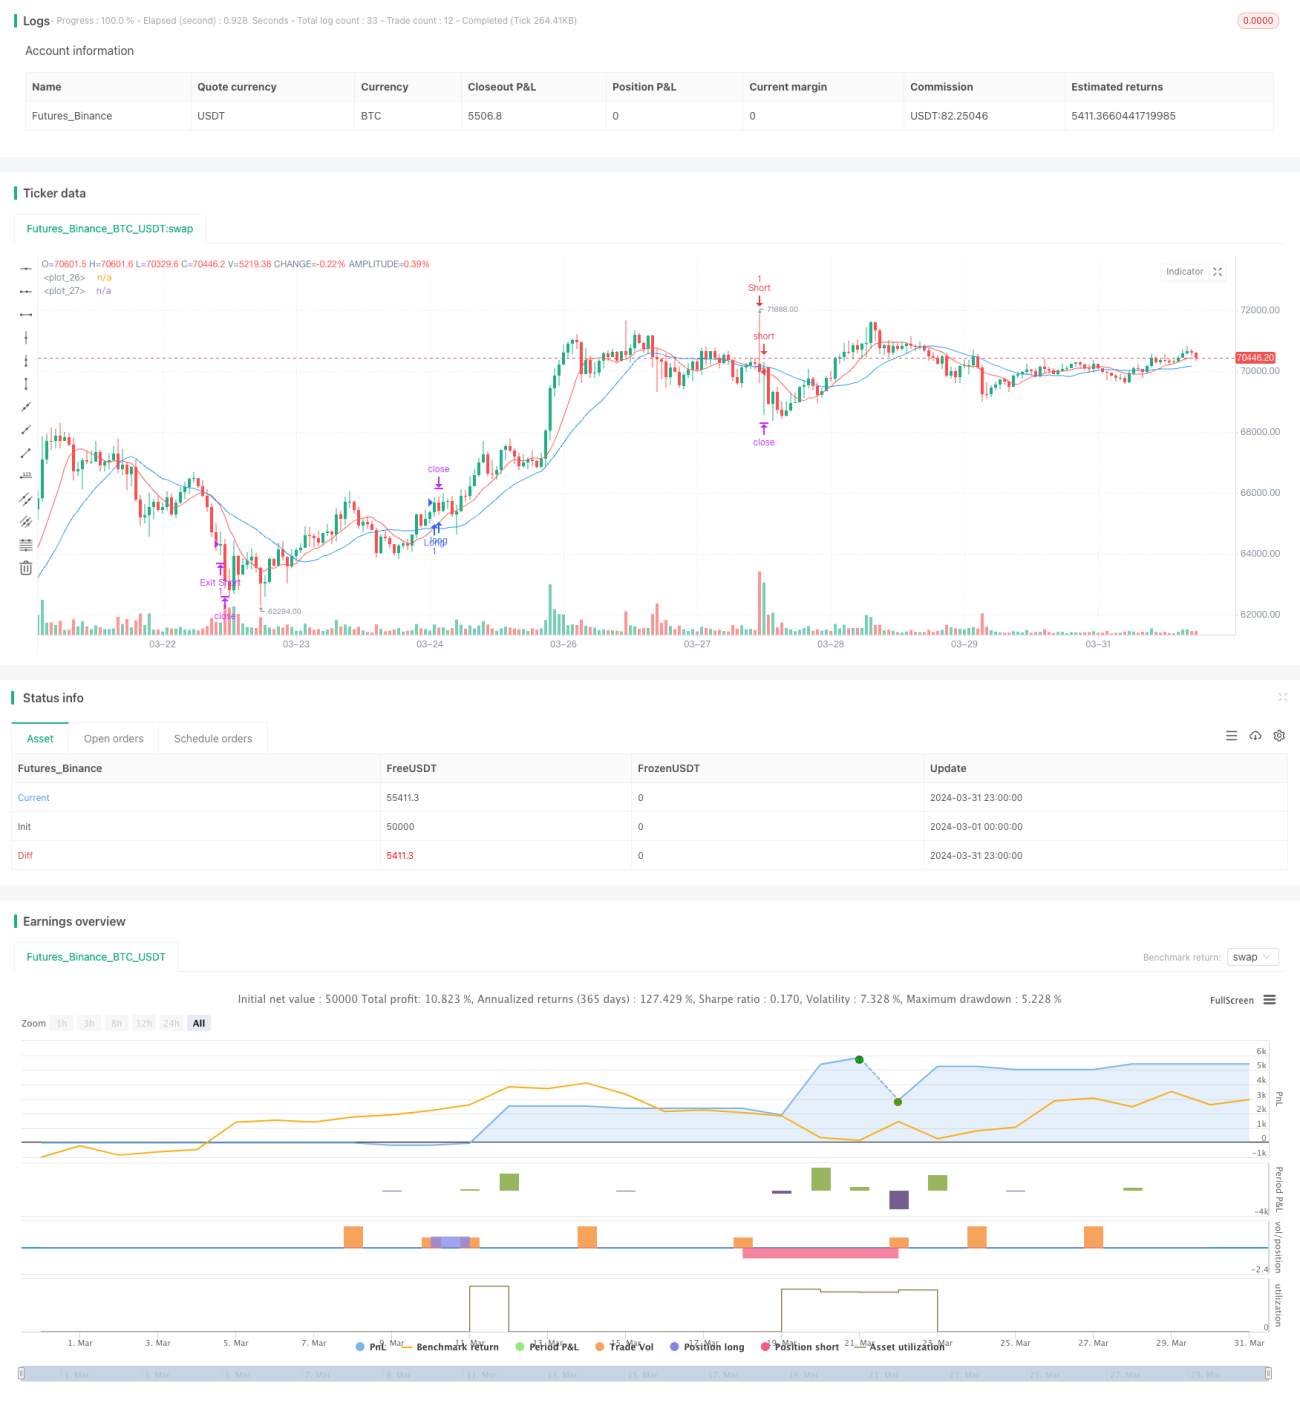
/*backtest
start: 2024-03-01 00:00:00
end: 2024-03-31 23:59:59
period: 1h
basePeriod: 15m
exchanges: [{"eid":"Futures_Binance","currency":"BTC_USDT"}]
*/

// This Pine Script™ code is subject to the terms of the Mozilla Public License 2.0 at https://mozilla.org/MPL/2.0/
// © financialAccou42381

//@version=5- 1