Chiến lược theo xu hướng dựa trên điểm Z

Tổng quan
Chiến lược theo dõi xu hướng dựa trên Z-value sử dụng chỉ số thống kê Z-value để nắm bắt cơ hội xu hướng bằng cách đo mức độ giá lệch khỏi đường trung bình di chuyển của nó và sử dụng chênh lệch tiêu chuẩn như một thước đo thống nhất. Chiến lược này nổi tiếng với tính đơn giản và hiệu quả, đặc biệt phù hợp với thị trường nơi biến động giá thường quay trở lại mức trung bình.
Nguyên tắc chiến lược
Cốt lõi của chiến lược này là tính toán giá trị Z. Giá trị Z được tính bằng cách tính chênh lệch giữa giá hiện tại và chỉ số giá động trung bình (EMA) của chiều dài định nghĩa của người dùng, sau đó chia chênh lệch theo tiêu chuẩn giá cùng chiều dài:
z = (x - μ) / σ
Trong đó, x là giá hiện tại, μ là EMA trung bình, σ là chênh lệch tiêu chuẩn.
Tín hiệu giao dịch được tạo ra dựa trên giá trị Z vượt qua ngưỡng dự kiến:
- Bước vào đa đầu: khi Z vượt ngưỡng chính.
- Nhiều đầu ra sân: Khi Z đi xuống vượt ngưỡng âm.
- Đầu không vào: khi Z đi xuống vượt ngưỡng âm.
- Bước ra sân bằng đầu rỗng: khi Z vượt ngưỡng chính.
Lợi thế chiến lược
- Tóm tắt và hiệu quả: Chiến lược này chỉ dựa trên một vài tham số, dễ hiểu và thực hiện, đồng thời hiệu quả trong việc nắm bắt các cơ hội xu hướng.
- Cơ sở thống kê: Giá trị Z là một công cụ thống kê thành thạo, cung cấp nền tảng lý thuyết vững chắc cho chiến lược này.
- Khả năng thích ứng: Bằng cách điều chỉnh các tham số như threshold, EMA và chu kỳ tính toán chênh lệch tiêu chuẩn, chiến lược này có thể thích ứng linh hoạt với các phong cách giao dịch và môi trường thị trường khác nhau.
- Tín hiệu rõ ràng: Các tín hiệu giao dịch dựa trên giá trị Z vượt qua ngưỡng là đơn giản và rõ ràng, giúp đưa ra quyết định và thực hiện nhanh chóng.
Rủi ro chiến lược
- Tham số nhạy cảm: Thiết lập tham số không phù hợp (ví dụ như ngưỡng quá cao hoặc quá thấp) có thể gây ra tín hiệu giao dịch bị lệch, bỏ lỡ cơ hội hoặc gây thiệt hại.
- Nhận biết xu hướng: Chiến lược này có thể gặp phải các tín hiệu sai lệch thường xuyên và hoạt động kém trong các biến động hoặc thị trường.
- Hiệu ứng trễ: Là một chiến lược theo dõi xu hướng, tín hiệu vào và ra của nó đều có độ trễ nhất định, có thể bỏ lỡ thời điểm tốt nhất.
Những rủi ro trên có thể được kiểm soát và giảm bớt thông qua phân tích thị trường liên tục, tối ưu hóa tham số và thực hiện thận trọng trên cơ sở đánh giá lại.
Hướng tối ưu hóa chiến lược
- Hạn chế động: giới thiệu các hạn chế động liên quan đến tỷ lệ biến động, có thể thích ứng hiệu quả với các tình trạng thị trường khác nhau, nâng cao chất lượng tín hiệu.
- Chỉ số kết hợp: tổng hợp các chỉ số kỹ thuật khác như RSI, MACD, v.v., xác nhận tín hiệu giao dịch lần thứ hai, tăng độ tin cậy.
- Quản lý vị trí: Bao gồm các cơ chế kiểm soát vị trí như ATR, giảm vị trí kịp thời trong thị trường biến động, tăng vị trí kịp thời trong thị trường xu hướng, tối ưu hóa tỷ lệ rủi ro lợi nhuận.
- Nhiều quy mô thời gian: tính toán Z-value trên nhiều quy mô thời gian, nắm bắt các xu hướng ở các cấp khác nhau, làm phong phú chiều chiến lược.
Tóm tắt
"Chiến lược theo dõi xu hướng dựa trên giá trị Z" với các đặc điểm đơn giản, mạnh mẽ và linh hoạt của nó, cung cấp một tầm nhìn độc đáo để nắm bắt cơ hội theo xu hướng. Bằng cách đặt các tham số hợp lý, quản lý rủi ro thận trọng và tối ưu hóa liên tục, chiến lược này có thể trở thành một trợ lý tuyệt vời cho các nhà giao dịch định lượng, tiến bộ vững chắc trong thị trường biến động.
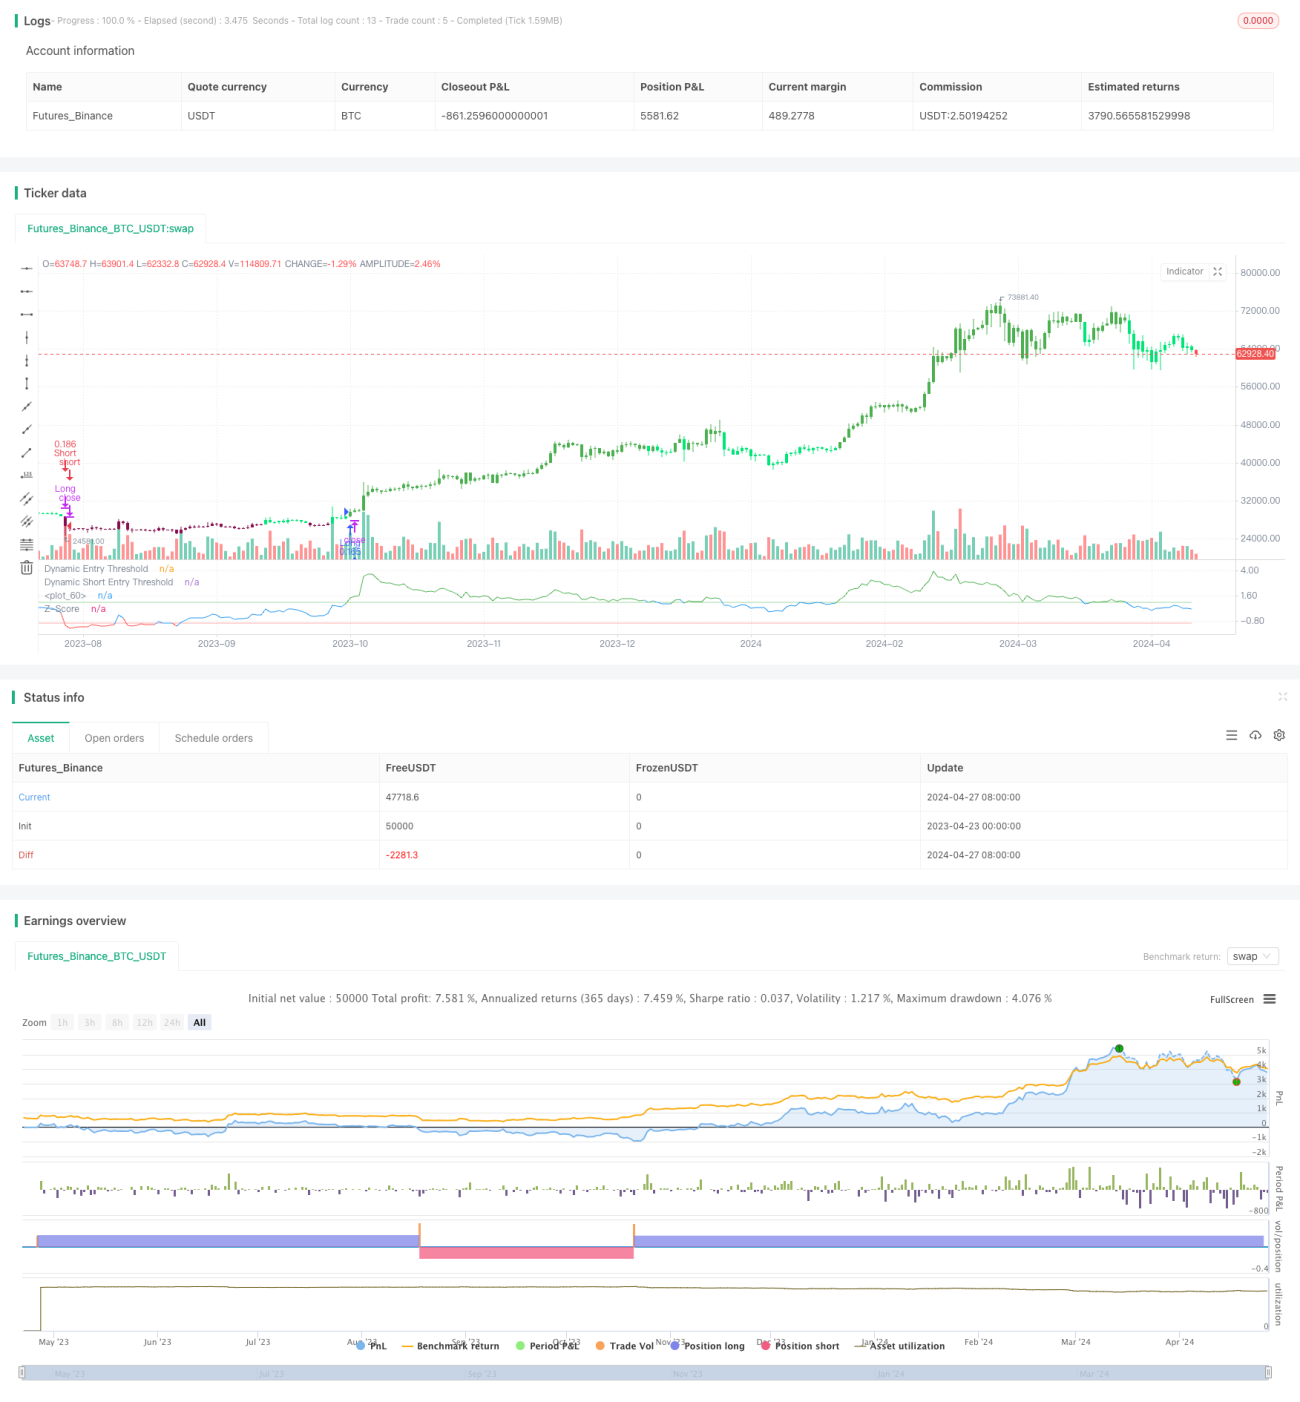
/*backtest
start: 2023-04-23 00:00:00
end: 2024-04-28 00:00:00
period: 1d
basePeriod: 1h
exchanges: [{"eid":"Futures_Binance","currency":"BTC_USDT"}]
*/

// This Pine Script™ code is subject to the terms of the Mozilla Public License 2.0 at https://mozilla.org/MPL/2.0/
// © PresentTrading

// This strategy employs a statistical approach by using a Z-score, which measures the deviation of the price from its moving average normalized by the standard deviation.- 1