Chiến lược giao dịch định lượng 5 phút với bộ lọc hai lớp độ lệch chuẩn dải Bollinger

Tổng quan
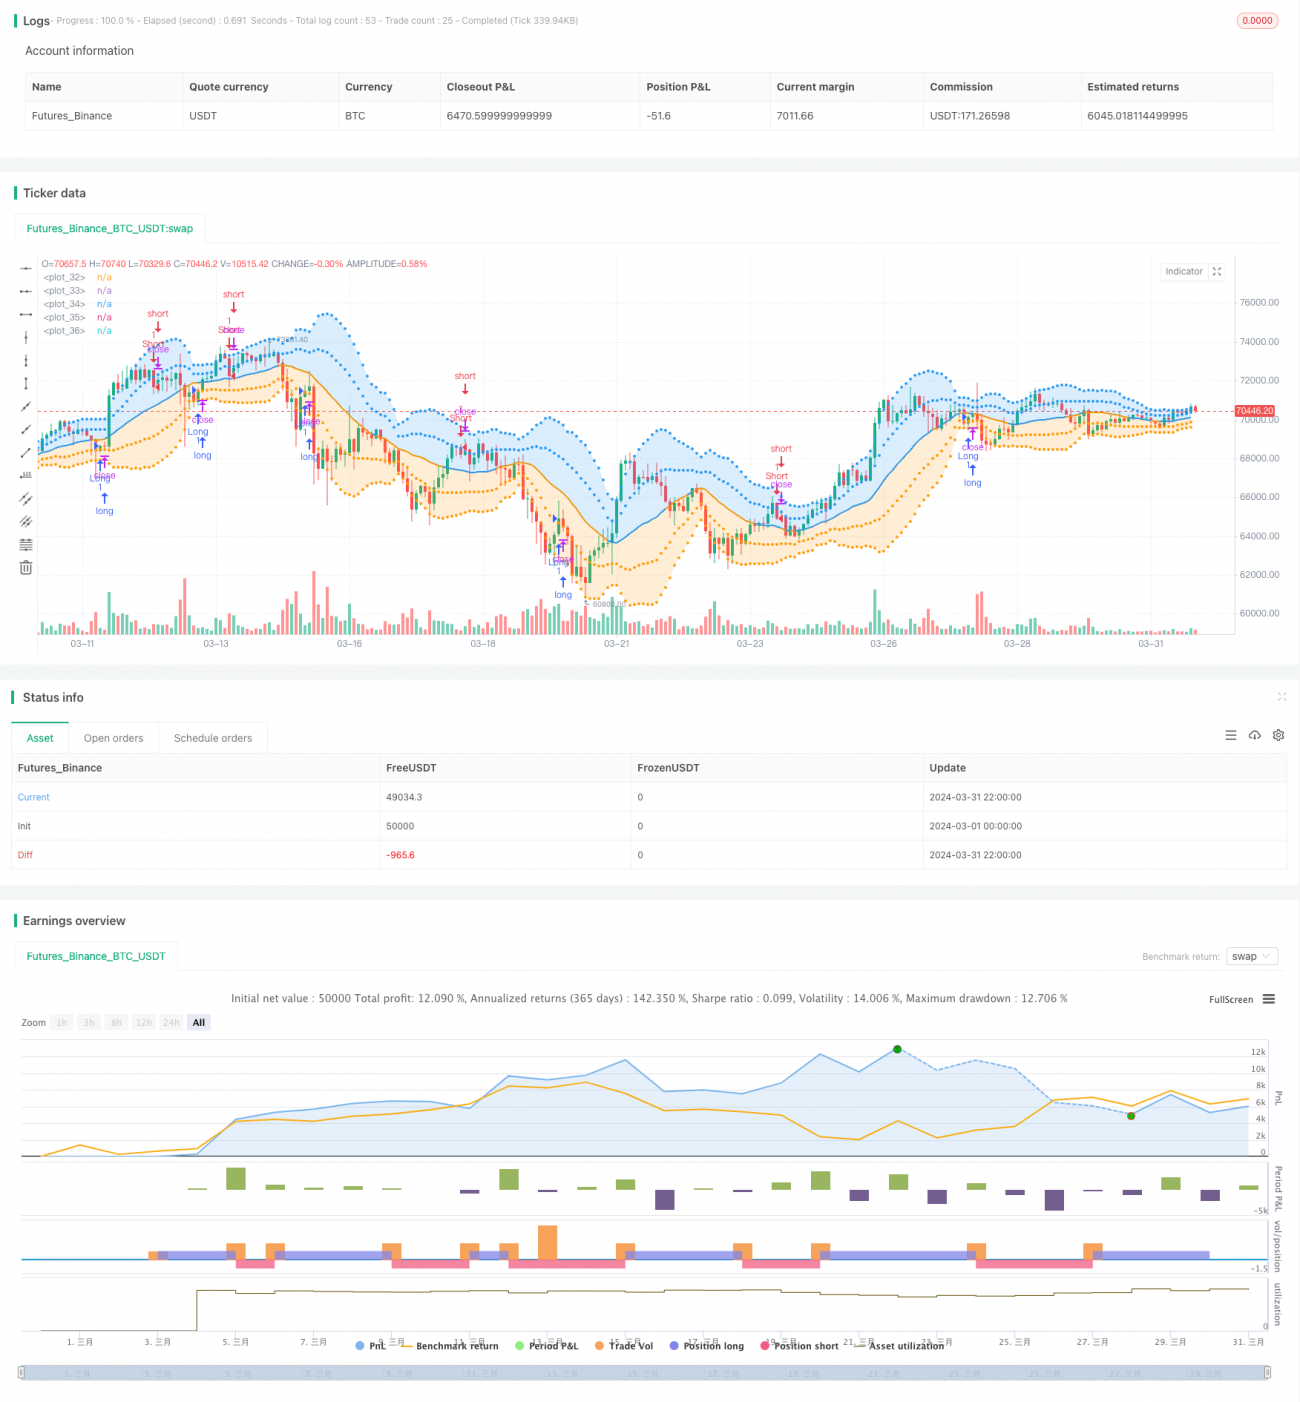
Chiến lược này dựa trên chỉ báo Bollinger Bands, sử dụng bộ lọc độ lệch chuẩn kép để thực hiện giao dịch nhanh trên khung thời gian 5 phút. Mua khi giá phá vỡ dải dưới, bán khi giá phá vỡ dải trên. Dải trên và dải dưới được thiết lập với các độ lệch chuẩn khác nhau và được đánh dấu bằng các màu sắc khác nhau, giúp trực quan hóa cường độ xu hướng.
Nguyên lý chiến lược
- Tính đường trung bình của Bollinger Bands, dải trên 1, dải trên 2, dải dưới 1 và dải dưới 2.
- Khi giá đóng cửa cắt lên từ dưới dải dưới 1, tín hiệu mua được phát sinh.
- Khi giá đóng cửa cắt xuống từ trên dải trên 1, tín hiệu bán được phát sinh.
- Sau khi mua, khi có tín hiệu bán thì đóng vị thế. Sau khi bán, khi có tín hiệu mua thì đóng vị thế.
- Dải trên 2 và dải dưới 2 đánh dấu cường độ xu hướng, hỗ trợ phán đoán bổ sung.
Ưu điểm chiến lược
- Thiết lập độ lệch chuẩn kép giúp tăng độ chính xác trong xác định xu hướng.
- Tần suất giao dịch ở khung 5 phút cao, phù hợp với lối vào nhanh ra nhanh.
- Hỗ trợ phán đoán cường độ xu hướng giúp kiểm soát rủi ro.
- Tham số có thể điều chỉnh, thích ứng với các thị trường khác nhau.
Rủi ro chiến lược
- Giao dịch thường xuyên có thể dẫn đến phí giao dịch cao.
- Sai lệch trong phán đoán xu hướng có thể gây thua lỗ.
- Thiếu biện pháp dừng lỗ, mức độ rủi ro cao.
- Khả năng nắm bắt xu hướng một chiều còn yếu.
Hướng tối ưu hóa chiến lược
- Đưa vào cơ chế dừng lỗ và chốt lời, kiểm soát rủi ro từng giao dịch.
- Tối ưu hóa tham số Bollinger Bands, nâng cao khả năng bắt xu hướng.
- Thêm các chỉ báo hỗ trợ xác định xu hướng như MA, tăng tỷ lệ thắng.
- Thiết lập bộ lọc cho thị trường đi ngang.
Tổng kết
Chiến lược này tận dụng đặc tính thống kê của Bollinger Bands, lọc kép giúp tăng cường phán đoán xu hướng, phù hợp để nhanh chóng nắm bắt cơ hội xu hướng trên khung 5 phút. Tuy nhiên, vấn đề giao dịch thường xuyên và thiếu biện pháp quản lý rủi ro vẫn cần được tối ưu. Trong tương lai, có thể tiếp tục hoàn thiện dừng lỗ/chốt lời, tối ưu tham số và phán đoán bổ sung, nâng cao độ ổn định và khả năng sinh lời tổng thể.
/*backtest
start: 2024-03-01 00:00:00
end: 2024-03-31 23:59:59
period: 2h
basePeriod: 15m
exchanges: [{"eid":"Futures_Binance","currency":"BTC_USDT"}]
*/

//@version=5
//This displays the traditional Bollinger Bands, the difference is
//that the 1st and 2nd StdDev are outlined with two colors and two
//different levels, one for each Standard Deviation- 1