Chiến lược đột phá độ lệch chuẩn của dải Bollinger

1
Follow
1788
Followers
Tổng quan
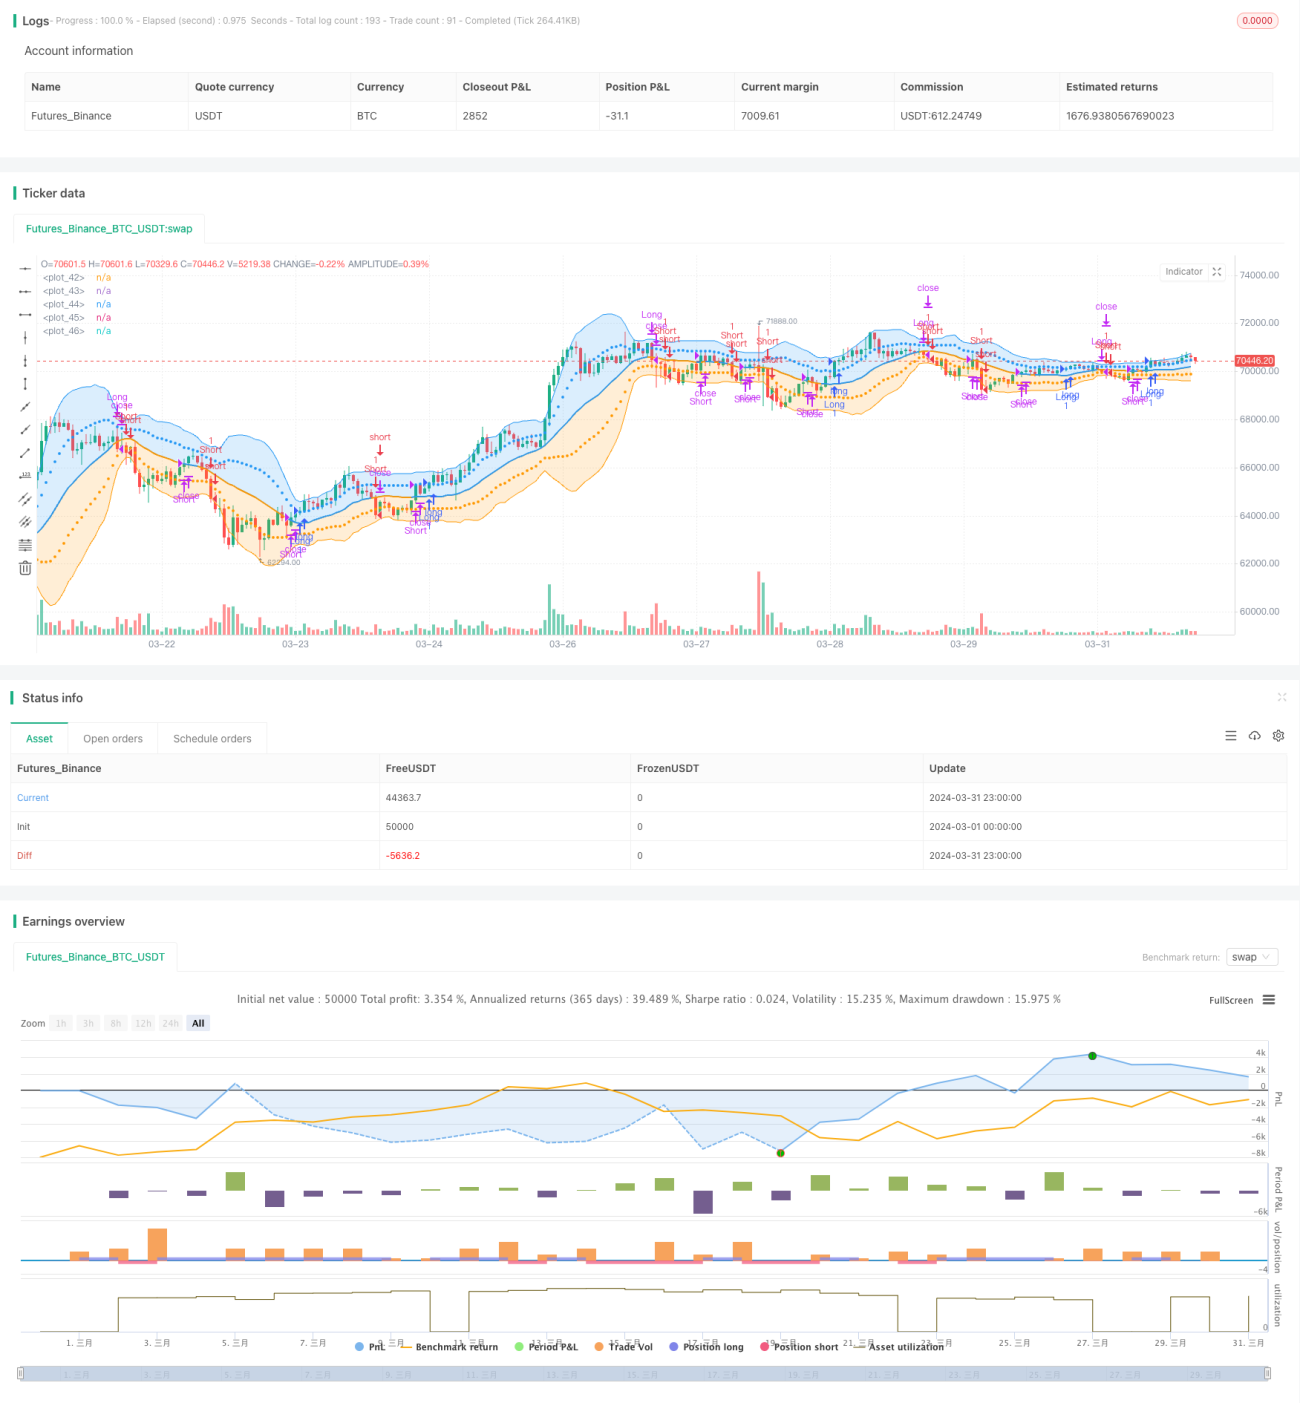
Chiến lược này dựa trên các chỉ số Brin, mở vị trí nhiều đầu khi giá đóng cửa phá vỡ đường lên, mở vị trí mở đầu khi giá đóng cửa rơi xuống đường. Điều kiện đặt hàng nhiều đầu là giá rơi xuống đường trung và điều kiện đặt hàng bằng không là giá phá vỡ đường trung. Chiến lược này sử dụng giá so với vị trí của Brin để xác định hướng xu hướng và thời gian mở vị trí.
Nguyên tắc chiến lược
- Tính toán đường viền trung và dưới trên lằn Brin. đường viền trung là đường trung bình di chuyển đơn giản của giá đóng cửa, đường viền trên và dưới là đường viền trung cộng và trừ đi một số nhân của chênh lệch chuẩn.
- Khi giá đóng cửa phá vỡ đường ray, hãy mở một vị trí đầu nhiều.
- Khi giá đóng cửa giảm xuống đường, hãy mở một vị trí mở đầu.
- Khi nắm giữ nhiều vị thế đầu, nếu giá đóng cửa rơi xuống đường trung bình, vị thế đầu sẽ bị thu hẹp.
- Khi nắm giữ vị trí đầu trống, nếu giá đóng cửa phá vỡ đường trung đạo, vị trí đầu trống sẽ bị xóa.
Lợi thế chiến lược
- Brin Belt có thể phản ánh hiệu quả phạm vi biến động và hướng xu hướng của giá, sử dụng vị trí của giá so với Brin Belt để tạo vị thế bán pháo, có thể nắm bắt xu hướng.
- Khoảng cách giữa đường lên xuống và đường xuống có một chênh lệch chuẩn nhất định, có thể thích nghi với sự thay đổi của tỷ lệ biến động giá, chênh lệch chuẩn càng lớn, khoảng cách giữa đường lên xuống càng xa.
- Điều kiện bằng phẳng sử dụng đường ray trung tâm, thay vì phá vỡ ngược lên xuống đường ray, có thể ngăn chặn trục trặc càng sớm càng tốt.
- Các tham số có thể được điều chỉnh, có thể tối ưu hóa các tham số như chu kỳ băng tần Brinh, nhân chênh lệch tiêu chuẩn để phù hợp với các giống và chu kỳ khác nhau.
Rủi ro chiến lược
- Trong một thị trường chấn động, giá sẽ dao động liên tục gần đường đua lên xuống, có thể xảy ra thường xuyên mở lỗ, dẫn đến tăng chi phí giao dịch.
- Khi giá tăng tốc xu hướng, điểm mở vị trí tương đối chậm và khả năng theo dõi gió yếu hơn.
- Trong giai đoạn đầu của xu hướng biến đổi, sự rút lui chạm vào điểm cân bằng giữa đường ray, và nếu xu hướng tiếp tục phát triển, nó sẽ bị mất tiếp theo.
Hướng tối ưu hóa chiến lược
- Có thể kết hợp các chỉ số dừng lỗ như ATR để kiểm soát rút lui.
- Bạn có thể sử dụng tỷ lệ động của vị trí trống nhiều, tùy thuộc vào cường độ của xu hướng.
- Các điều kiện mở kho có thể được kết hợp với các điều kiện lọc hơn, chẳng hạn như chỉ số giá trị, để tăng độ tin cậy của tín hiệu mở kho.
Tóm tắt
Chiến lược này là một chiến lược theo dõi xu hướng cổ điển, thông qua Brin để nắm bắt xu hướng. Logic của chiến lược rõ ràng, lợi thế rõ ràng, nhưng cũng có một số rủi ro. Có thể cải thiện hiệu suất chiến lược, cải thiện khả năng thích ứng bằng cách tối ưu hóa lệnh dừng lỗ, quản lý vị trí và lọc vị trí.
Source
Pine
/*backtest
start: 2024-03-01 00:00:00
end: 2024-03-31 23:59:59
period: 1h
basePeriod: 15m
exchanges: [{"eid":"Futures_Binance","currency":"BTC_USDT"}]
*/

//@version=5
// Bollinger Bands: Madrid : 14/SEP/2014 11:07 : 2.0
// This displays the traditional Bollinger Bands, the difference is
// that the 1st and 2nd StdDev are outlined with two colors and twoStrategy parameters
Related strategies
Comment
All comments (0)
No data
- 1