Chiến lược giao dịch theo xu hướng động EMA

Tổng quan
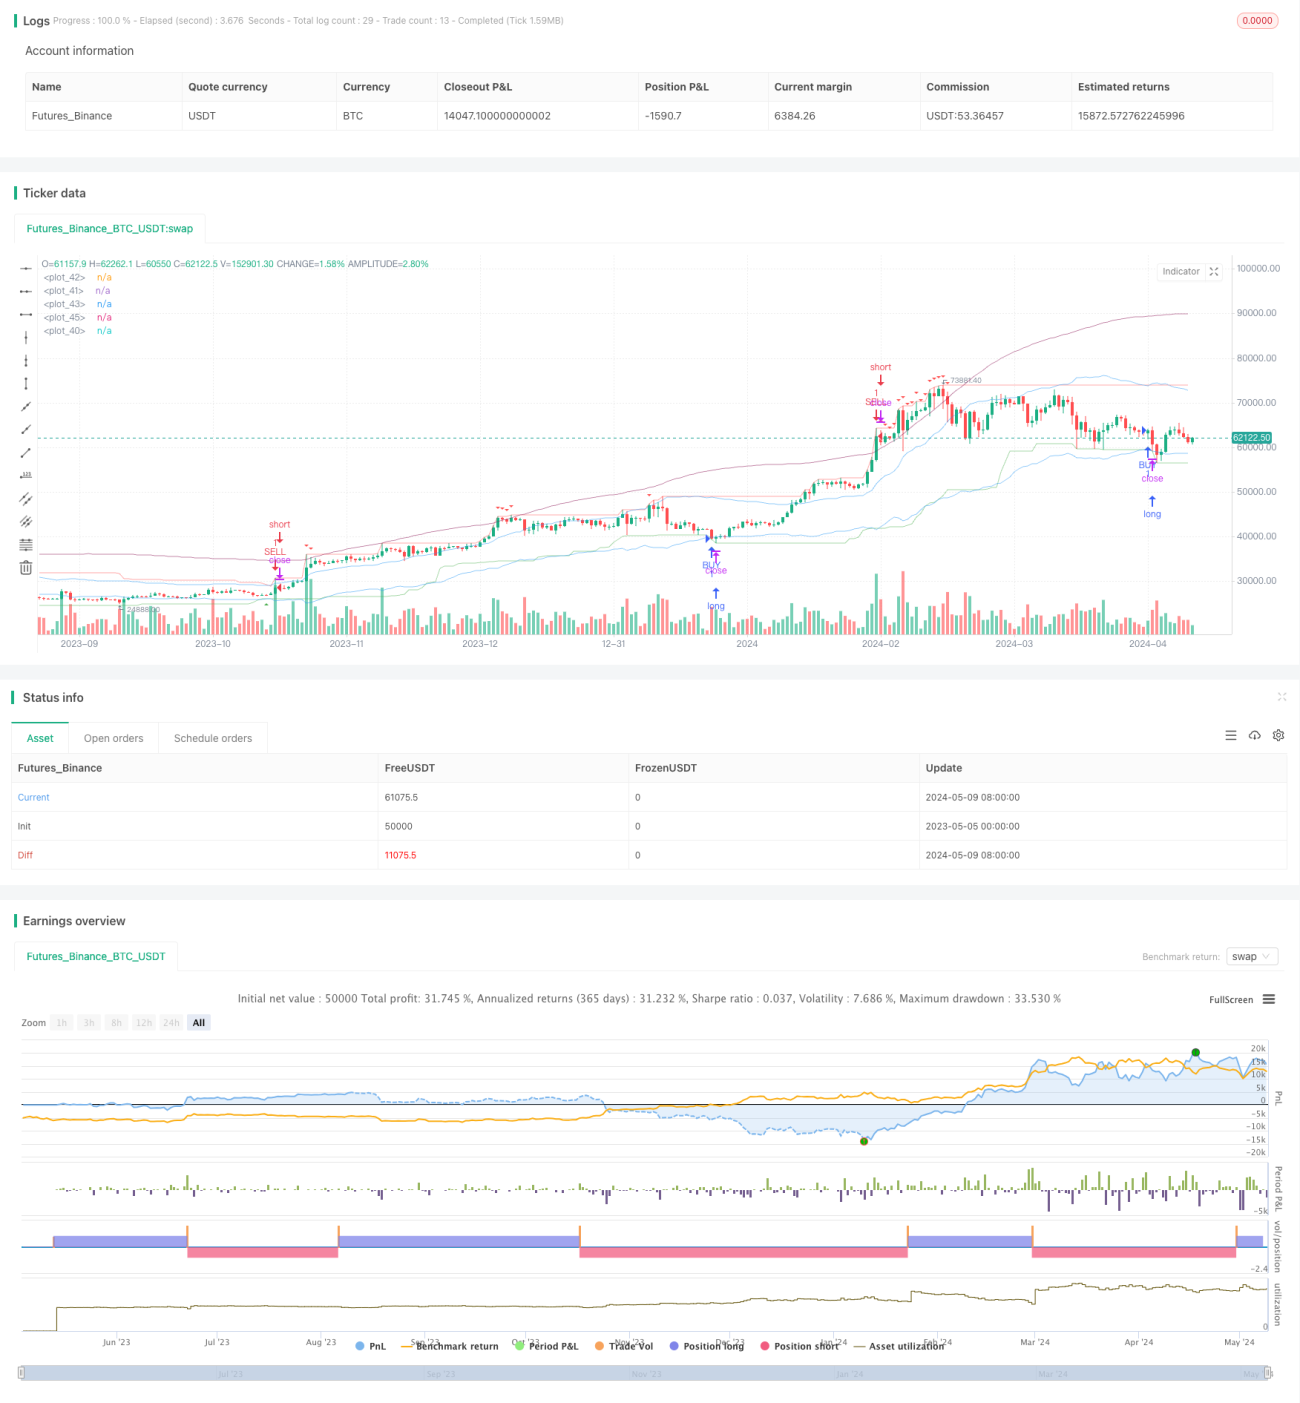
Chiến lược này sử dụng các chỉ số kỹ thuật như đường trung bình di chuyển chỉ số (EMA), giá cao nhất, giá thấp nhất và đường trung bình thực tế (ATR) để xác định hướng xu hướng hiện tại bằng cách đánh giá mối quan hệ của giá với EMA, giá cao nhất và giá thấp nhất, mua khi giá phá vỡ giá thấp nhất lên, bán khi giá phá vỡ giá cao nhất xuống hoặc chạm mức kháng cự động để nắm bắt xu hướng và thu được lợi nhuận vượt trội.
Nguyên tắc chiến lược
- Tính toán ATR, được sử dụng để đo lường sự biến động của thị trường, cung cấp cơ sở để xây dựng các kênh động.
- Tính toán giá cao nhất và giá thấp nhất để đánh giá xu hướng.
- Tính EMA_HL, tức là giá cao nhất và giá thấp nhất của EMA, làm trục trung tâm của kênh động.
- Tính toán EMA_HIGHEST và EMA_LOWEST, tức là trên cơ sở EMA_HL cộng trừ ATR nhân một tỷ lệ nhất định.
- Tính toán SELL_LINE, tức là mức kháng động động được nhân với ATR theo tỷ lệ nhất định dựa trên giá cao nhất.
- Xác định tín hiệu đa đầu: tạo tín hiệu mua khi EMA_LOWEST phá giá thấp nhất và giá đóng cửa thấp hơn EMA_MID
- Xác định tín hiệu trống: Khi EMA_HIGHEST phá vỡ giá cao nhất xuống và giá đóng cửa cao hơn EMA_MID, hoặc khi giá cao nhất chạm SELL_LINE, tạo ra tín hiệu bán.
Chiến lược ưu thế
- Dấu hiệu tín hiệu có độ tin cậy cao khi sử dụng EMA, giá cao nhất, giá thấp nhất và các chỉ số tổng hợp để đánh giá xu hướng.
- Tham gia ATR như là một tiêu chuẩn để đo lường tỷ lệ biến động, xây dựng các kênh năng động, thích ứng với các tình trạng thị trường khác nhau.
- Thiết lập mức kháng cự động của SELL_LINE, khóa lợi nhuận kịp thời và kiểm soát rủi ro rút tiền.
- Các tham số có thể điều chỉnh, thích ứng với các giống và chu kỳ khác nhau, có tính phổ biến và linh hoạt.
"Tuy nhiên, chúng tôi vẫn chưa có kế hoạch.
- Có thể có sự chậm trễ trong việc nhận diện xu hướng, dẫn đến thời gian nhập cảnh không phù hợp.
- Thiết lập tham số không đúng có thể dẫn đến tín hiệu thường xuyên, tăng chi phí giao dịch.
- Đối với thị trường chấn động, chiến lược có thể không hoạt động tốt và cần kết hợp với các phương pháp khác.
- Trong trường hợp cực đoan, như chuyển đổi đĩa nhanh, chiến lược có thể không hiệu quả, cần thiết phải thiết lập dừng lỗ.
Định hướng tối ưu hóa chiến lược
- Tiếp tục giới thiệu thêm các chỉ số như số lượng giao dịch, tỷ lệ dao động, v.v., làm phong phú chiều hướng phán đoán, tăng tín hiệu tin cậy.
- Tối ưu hóa các tham số, chẳng hạn như ATR, chu kỳ EMA, tìm các tham số kết hợp tối ưu, tăng sự ổn định của chiến lược.
- Tham gia quản lý vị trí, chẳng hạn như điều chỉnh vị trí theo động thái ATR, kiểm soát lỗ hổng rủi ro đơn.
- Thiết lập dừng lỗ và chặn, kiểm soát lỗ tối đa và lợi nhuận tối đa, tăng tỷ lệ lợi nhuận rủi ro.
- Kết hợp với các chiến lược khác, chẳng hạn như chiến lược đột phá, chiến lược quay trở lại giá trị trung bình, để tạo ra một danh mục chiến lược, cải thiện sự ổn định tổng thể.
Tóm lại
Chiến lược này sử dụng các chỉ số kỹ thuật như EMA, giá cao nhất, giá thấp nhất, kết hợp với ATR để xây dựng các kênh động, tạo ra tín hiệu giao dịch bằng cách phá vỡ giá cao nhất và giá thấp nhất để nắm bắt xu hướng. Đây là một chiến lược theo dõi xu hướng thực tế đơn giản. Các tham số chiến lược có thể điều chỉnh, thích ứng và linh hoạt, nhưng có thể hoạt động kém trong thị trường xung đột, cần được tối ưu hóa và cải thiện hơn nữa bằng cách giới thiệu nhiều chỉ số, tối ưu hóa tham số, thêm kiểm soát gió.
- 1