Chiến lược vị thế mua RSI50_EMA

1
Follow
1780
Followers
Tổng quan
Chiến lược này được gọi là chiến lược RSI50_EMA dài, và ý tưởng chính là sử dụng tín hiệu chéo của hai chỉ số kỹ thuật của chỉ số tương đối yếu ((RSI) và chỉ số di chuyển trung bình ((EMA) để đưa ra quyết định giao dịch.
Nguyên tắc chiến lược
- Tính EMA và ATR, có EMA lên và xuống đường.
- Tính toán RSI
- Khi giá đóng cửa vượt qua EMA và RSI lớn hơn 50, hãy mở thêm.
- Khi giá đóng cửa vượt qua đường EMA hoặc RSI giảm xuống 50 thì xóa tất cả các lệnh.
- Hãy làm nhiều hơn, đừng làm ít.
Lợi thế chiến lược
- Nó được sử dụng trong các thị trường mạnh mẽ, có thể nắm bắt hiệu quả các hoạt động tăng giá của các cổ phiếu mạnh mẽ.
- Sử dụng cả hai chỉ số EMA và RSI để xác nhận tín hiệu xu hướng tốt hơn và tăng độ tin cậy tín hiệu.
- Quản lý vị trí sử dụng tỷ lệ dừng lỗ, rủi ro có thể kiểm soát được.
- Khóa học có logic rõ ràng, đơn giản, dễ hiểu và dễ thực hiện.
Rủi ro chiến lược
- Trong một thị trường chấn động, các giao dịch thường xuyên và rút tiền lớn có thể xảy ra.
- Chọn tham số không đúng sẽ dẫn đến tín hiệu không hiệu quả. Ví dụ: chọn chiều dài EMA không đúng sẽ dẫn đến sự chậm trễ trong việc đánh giá xu hướng; chọn giới hạn trên và dưới của RSI không đúng sẽ dẫn đến điểm mở lỗ không mong muốn.
- Các chiến lược chỉ có thể nắm bắt được các xu hướng tăng một chiều, không thể nắm bắt được các xu hướng giảm và dao động, dễ bị trượt.
Hướng tối ưu hóa chiến lược
- Các chỉ số xác nhận xu hướng, như MACD, được đưa vào để cải thiện tính chính xác của xu hướng.
- Tối ưu hóa tham số cho RSI, hoặc giới thiệu các tín hiệu cải tiến như RSI deviation.
- Xem xét thêm dừng di chuyển hoặc dừng dao động, cải thiện kiểm soát gió.
- Bạn có thể xem xét tham gia vào các thị trường chấn động và xu hướng giảm trong logic mở cửa vị trí đảo ngược.
Tóm tắt
Chiến lược RSI50_EMA là một chiến lược theo dõi xu hướng đơn giản và dễ sử dụng dựa trên RSI và EMA, phù hợp để sử dụng trong tình huống leo thang một bên. Chiến lược có logic rõ ràng, lợi thế rõ ràng, nhưng cũng có một số thiếu sót và rủi ro. Bằng cách giới thiệu nhiều chỉ số hỗ trợ, tham số tối ưu hóa, cải thiện kiểm soát rủi ro và các biện pháp khác, có thể nâng cao hơn nữa sự ổn định và lợi nhuận của chiến lược.
Source
Pine
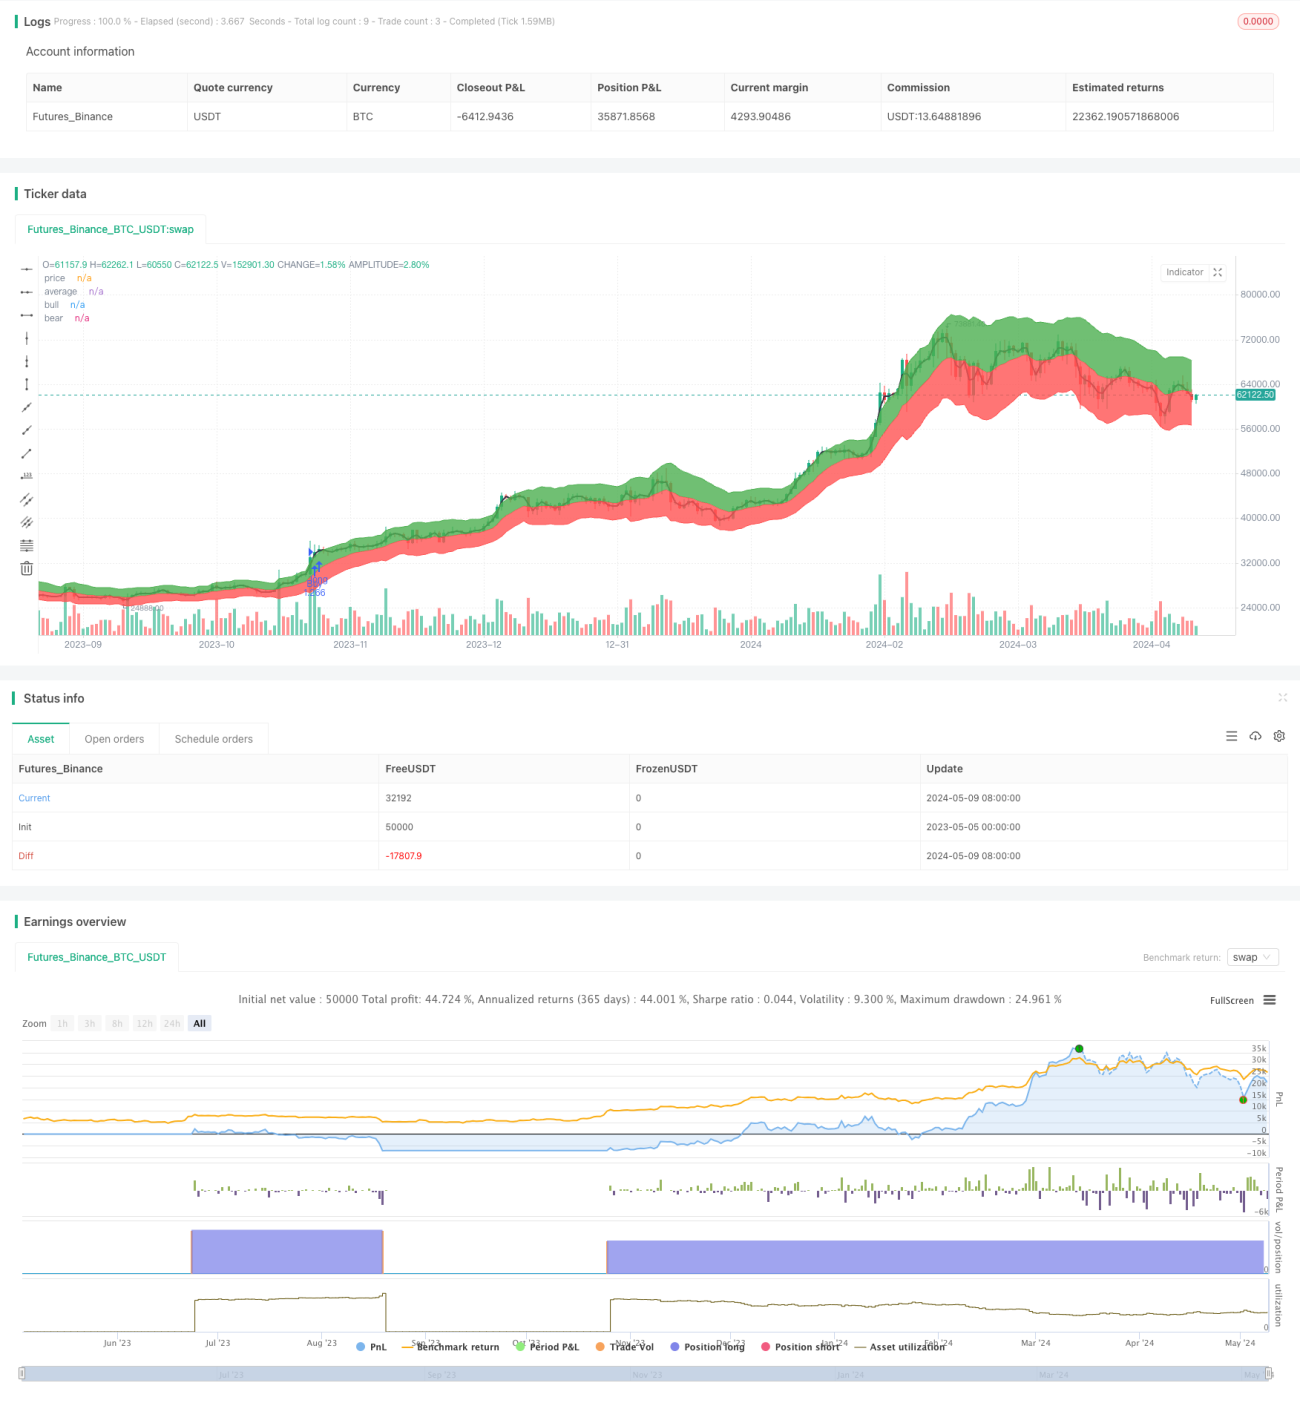
/*backtest
start: 2023-05-05 00:00:00
end: 2024-05-10 00:00:00
period: 1d
basePeriod: 1h
exchanges: [{"eid":"Futures_Binance","currency":"BTC_USDT"}]
*/

//@version=4
strategy("RSI50_EMA Long Only Strategy", overlay=true, default_qty_type=strategy.percent_of_equity, default_qty_value=100)

len = input(11, type=input.integer, minval=1, title="Length")Strategy parameters
Related strategies
Comment
All comments (0)
No data
- 1