Chiến lược theo dõi xu hướng ATR của Bollinger Bands

1
Follow
1781
Followers
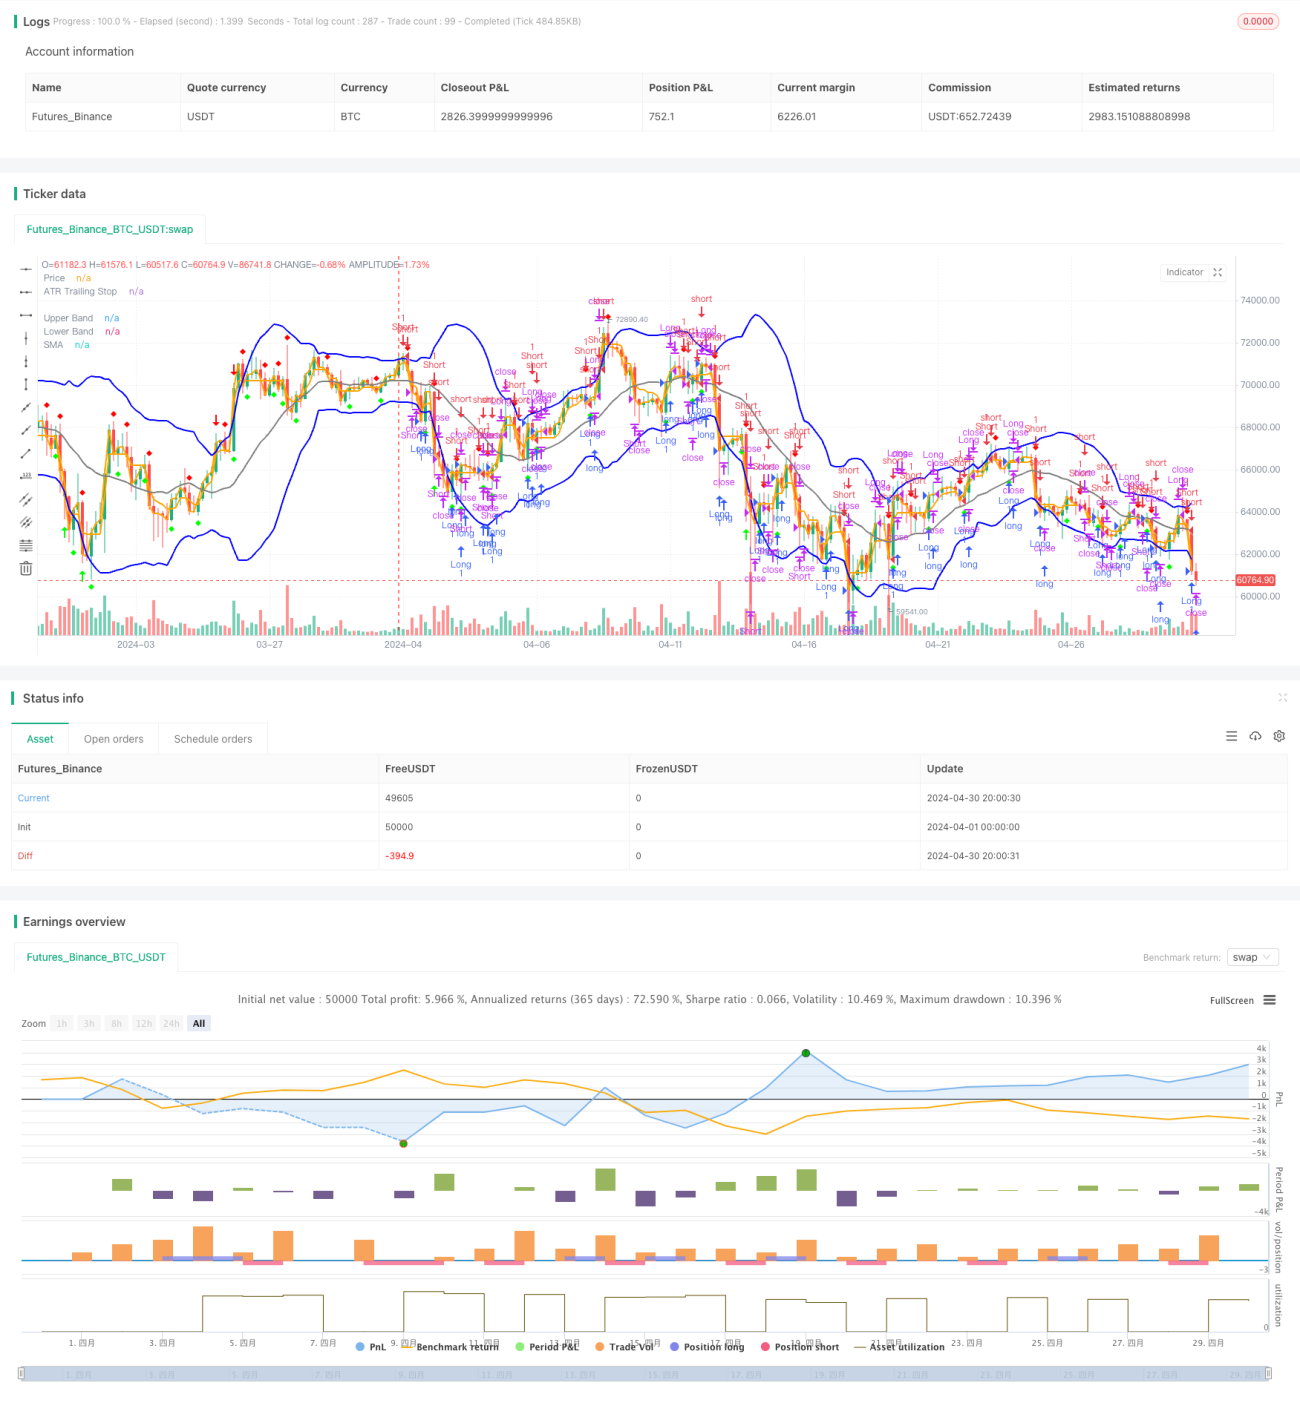
Tổng quan
Chiến lược này dựa trên các chỉ số Brin và ATR, lấy phạm vi biến động của giá thông qua Brin, sử dụng giá phá vỡ Brin và xuống đường như một tín hiệu đặt hàng, đồng thời sử dụng ATR như một dừng di chuyển, và cuối cùng với giá phá vỡ đường trung bình di chuyển đơn giản như một tín hiệu đặt hàng. Chiến lược này cố gắng nắm bắt tình trạng xu hướng, đặt hàng theo hướng xu hướng và đồng thời giữ vị trí yên khi xu hướng đảo ngược.
Nguyên tắc chiến lược
- Tính toán Burin Band: Sử dụng giá đóng cửa để tính toán đường trung bình di chuyển đơn giản ((SMA) làm đường trung tâm của Burin Band và tính toán đường trên và đường dưới dựa trên tỷ lệ dao động ((SDR)).
- Tính ATR: Sử dụng trung bình di chuyển của tần số sóng thực ((TR) để tính ATR, làm cơ sở cho việc dừng di chuyển.
- Tạo tín hiệu giao dịch: Tạo tín hiệu nhiều khi giá phá vỡ đường dây Brin xuống, tạo tín hiệu bỏ phiếu khi giá phá vỡ đường dây Brin lên; Tạo tín hiệu nhiều khi giá phá vỡ ATR dừng chân di chuyển, tạo tín hiệu bỏ phiếu khi giá phá vỡ ATR dừng chân di chuyển.
- Vị thế ngang: Khi thực hiện nhiều vị thế, nếu giá phá vỡ đường trung bình di chuyển đơn giản lên thì sẽ ngang; Khi thực hiện vị thế ngang, nếu giá phá vỡ đường trung bình di chuyển đơn giản xuống thì sẽ ngang.
Lợi thế chiến lược
- Theo dõi xu hướng: Ghi nhận xu hướng thông qua Brin và ATR để thích ứng với các môi trường thị trường khác nhau.
- Hạn chế kịp thời: Sử dụng ATR như là dừng di chuyển, bạn có thể điều chỉnh vị trí dừng động theo biến động của thị trường, kiểm soát rủi ro.
- Dễ sử dụng và đơn giản: logic chiến lược rõ ràng, ít tham số, dễ hiểu và áp dụng.
Rủi ro chiến lược
- Thuyết điểm nhạy cảm: Lựa chọn các tham số của Blink và ATR có thể ảnh hưởng đến hiệu suất chiến lược và cần được tối ưu hóa cho các thị trường và giống khác nhau.
- Thị trường biến động: Trong môi trường thị trường biến động, các tín hiệu giao dịch thường xuyên có thể dẫn đến quá nhiều giao dịch và chi phí.
- Trở lại xu hướng: Chiến lược có thể tạo ra sự rút lui lớn hơn khi xu hướng bị đảo ngược.
Hướng tối ưu hóa chiến lược
- Tối ưu hóa tham số: Tối ưu hóa các tham số của Brin và ATR để tìm ra sự kết hợp tham số tốt nhất cho các thị trường và giống khác nhau.
- Bộ lọc: Thêm các chỉ số kỹ thuật khác hoặc mô hình hành vi giá làm bộ lọc, giảm sai lầm và cải thiện chất lượng tín hiệu.
- Quản lý vị trí: Điều chỉnh vị trí theo biến động của thị trường hoặc rủi ro tài khoản để cải thiện hiệu quả sử dụng vốn và tỷ lệ rủi ro lợi nhuận.
Tóm tắt
Chiến lược theo dõi xu hướng ATR của Brin có lợi thế theo dõi xu hướng, dừng lỗ kịp thời và dễ sử dụng. Tuy nhiên, cũng có rủi ro như nhạy cảm với tham số, thị trường rung động và đảo ngược xu hướng. Hiệu suất của chiến lược có thể được tối ưu hóa hơn nữa bằng cách tối ưu hóa tham số, thêm bộ lọc và quản lý vị trí.
Source
Pine
Strategy parameters
Related strategies
Comment
All comments (0)
No data
- 1