Chiến lược giao dịch One Cloud Multiple Moving Average

Tổng quan
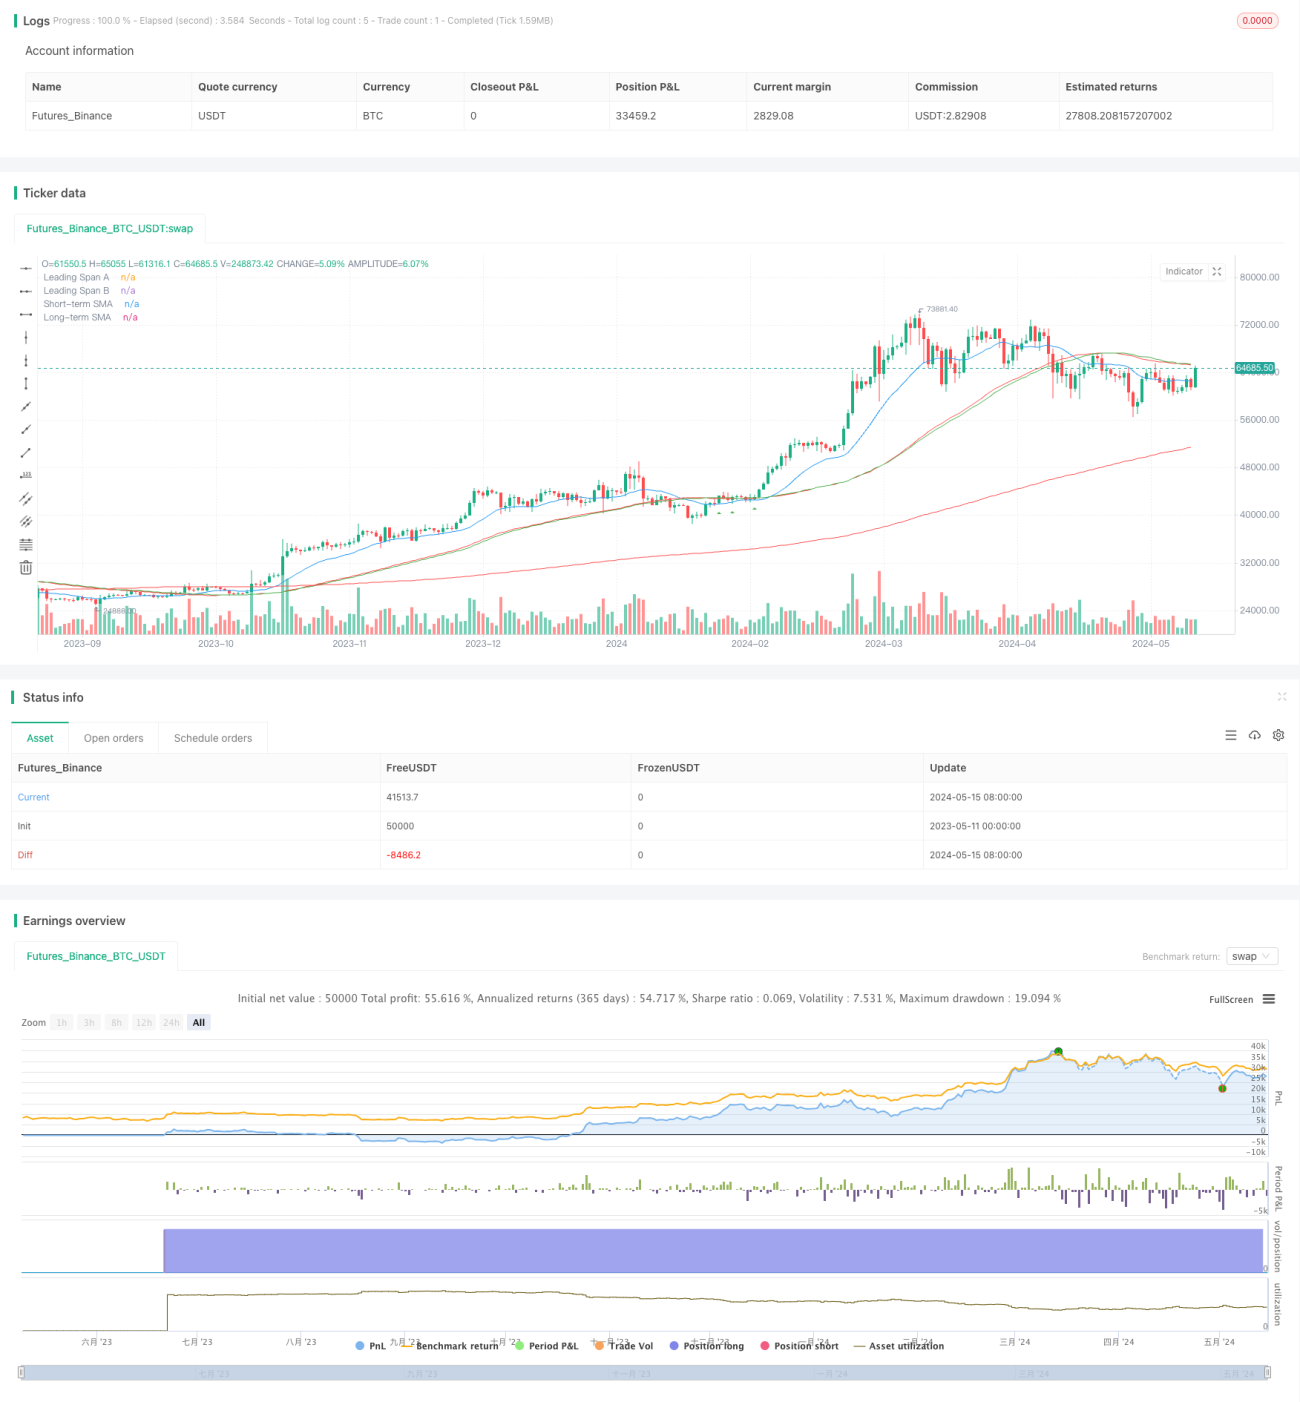
Chiến lược này kết hợp một đám mây biểu đồ cân bằng đầu tiên và các đường trung bình di chuyển đơn giản ngắn hạn (55) và dài hạn (200) để xác định tín hiệu mua bán tiềm năng. Các tín hiệu mua cần phải có giá cao hơn đám mây và SMA dài hạn và đi qua SMA ngắn hạn sau khi đi qua SMA ngắn hạn. Các tín hiệu bán cần phải có giá thấp hơn đám mây và SMA dài hạn và đi qua SMA ngắn hạn sau khi đi qua SMA ngắn hạn.
Nguyên tắc chiến lược
Chiến lược này dựa trên các nguyên tắc sau:
- Khi giá cao hơn đám mây và SMA dài, thị trường đang trong xu hướng tăng.
- Thị trường có xu hướng giảm khi giá thấp hơn đám mây và SMA dài.
- Các đà tăng và giảm của SMA ngắn hạn có thể xác nhận xu hướng, và đà tăng trở lại của SMA ngắn hạn cung cấp cơ hội nhập vào rủi ro thấp.
- Trong thị trường chứng khoán và các sự kiện tin tức lớn, có nhiều tín hiệu giả, nên tránh giao dịch.
Chương trình đầu tiên tính toán các thành phần đám mây đầu tiên cần thiết ((đường chuyển đổi, đường chuẩn, span A và B), và SMA ngắn hạn và dài hạn. Sau đó, xác định nhiều điều kiện để xác định vị trí của giá so với đám mây và đường thẳng.
Lợi thế chiến lược
- Kết hợp nhiều chỉ số xác nhận xu hướng, tăng độ tin cậy tín hiệu. Mây có thể lọc ra rất nhiều tiếng ồn, chéo SMA có thể xác nhận xu hướng.
- Trong một xu hướng đã được xác nhận, tìm kiếm một cơ hội để quay trở lại đường trung bình có nguy cơ tương đối thấp.
- Tiếp tục giảm rủi ro tín hiệu giả mạo bằng cách tránh giao dịch trong thị trường ngang và các sự kiện tin tức quan trọng.
- Nó có thể được sử dụng cho các giao dịch trung và dài hạn như 1 giờ và 2 giờ, để nắm bắt được xu hướng lớn và lợi nhuận lớn.
Rủi ro chiến lược
- Trong thời gian chuyển hướng có thể xảy ra thua lỗ. Mặc dù đường trung bình và phá vỡ đám mây có thể xác nhận xu hướng, nhưng sự chậm trễ vẫn còn tồn tại.
- Không có vị trí dừng lỗ rõ ràng. Các điều kiện hiện tại chủ yếu tập trung vào thời gian vào sân, nhưng không xác định vị trí ra sân cụ thể.
- Lựa chọn tham số có tính chủ quan và không chắc chắn. Các lựa chọn khác nhau như tham số lớp mây, chiều dài đường trung bình sẽ ảnh hưởng đến hiệu suất của chiến lược.
Hướng tối ưu hóa chiến lược
- Thêm các vị trí dừng rõ ràng, chẳng hạn như mức thấp trước khi phá vỡ / cao trước khi phá vỡ, số lần ATR, v.v. để giảm rủi ro giao dịch đơn.
- So sánh với các chỉ số xác nhận xu hướng khác như MACD, DMI, v.v., tạo ra một sự kết hợp tín hiệu vững chắc và đáng tin cậy hơn.
- Tối ưu hóa cho các tham số, tìm ra sự kết hợp tham số tốt nhất, nâng cao khả năng thích ứng của chiến lược trong các tình trạng thị trường khác nhau.
- Phân biệt thị trường xu hướng và thị trường chấn động, tham gia tích cực vào thị trường xu hướng và giảm tần suất giao dịch thích hợp trong thị trường chấn động.
Tóm tắt
Chiến lược giao dịch nhiều đường trung bình trên một đám mây này tìm kiếm cơ hội đầu vào có rủi ro thấp để quay trở lại đường trung bình trong xu hướng đã được thiết lập bằng cách kết hợp đám mây biểu đồ cân bằng đầu tiên và đường trung bình di chuyển đơn giản. Bằng cách lọc các giao dịch trong các thị trường ngang và các sự kiện tin tức quan trọng, chiến lược này có thể làm giảm nguy cơ tín hiệu giả, do đó cải thiện hiệu suất tổng thể. Chiến lược này chủ yếu phù hợp với những người giao dịch trung bình dài hạn, hoạt động tốt trên các khung thời gian như 1 giờ và 2 giờ.
- 1