Chiến lược mua và bán dựa trên bản đồ nhiệt khối lượng và giá theo thời gian thực

Tổng quan
Chiến lược này kết hợp biểu đồ nóng giao dịch và giá trong thời gian thực để tạo ra tín hiệu mua và bán bằng cách phân tích phân bố giá và khối lượng giao dịch trong một khoảng thời gian nhất định. Chiến lược này đầu tiên tính toán một số mức giá dựa trên giá hiện tại và tỷ lệ phần trăm của phạm vi giá được thiết lập. Sau đó, tính toán số lượng giao dịch mua và bán trong một khoảng thời gian qua cho mỗi mức giá và tính toán khối lượng giao dịch mua và bán tích lũy. Dựa trên khối lượng giao dịch mua và bán tích lũy, xác định màu sắc của nhãn.
Nguyên tắc chiến lược
- Một số mức giá được tính dựa trên tỷ lệ phần trăm của giá hiện tại và phạm vi giá được thiết lập.
- Đánh giá khối lượng giao dịch mua bán trong mỗi mức giá trong một khoảng thời gian trước đó và tính toán khối lượng giao dịch mua bán tích lũy.
- Xác định màu sắc của nhãn và hiển thị nhãn hoặc vẽ hình ảnh dựa trên khối lượng giao dịch mua bán tích lũy.
- Định hình đường cong giá trong thời gian thực.
- Tính toán các chỉ số như EMA, VWAP.
- Xác định liệu điều kiện mua có được đáp ứng hay không dựa trên mối quan hệ của giá với các chỉ số như EMA, VWAP và điều kiện khối lượng giao dịch. Nếu điều kiện mua được đáp ứng và không có tín hiệu trước đó, tín hiệu mua sẽ được tạo ra.
- Xác định liệu điều kiện bán có được đáp ứng hay không dựa trên mối quan hệ của giá với các chỉ số như EMA và điều kiện khối lượng giao dịch. Nếu điều kiện được đáp ứng và không có tín hiệu trước đó, thì sẽ có tín hiệu bán. Nếu hai sợi âm liên tiếp và không có tín hiệu trước đó, cũng sẽ có tín hiệu bán.
- Ghi lại tình trạng mua bán hiện tại và cập nhật tình trạng phát sinh tín hiệu.
Phân tích lợi thế
- Kết hợp với biểu đồ nóng khối lượng giao dịch và giá thời gian thực, nó có thể hiển thị trực quan sự phân bố của giá cả và khối lượng giao dịch, cung cấp tài liệu tham khảo cho các quyết định giao dịch.
- Các chỉ số như EMA, VWAP được đưa ra, làm phong phú các quyết định của chiến lược và tăng độ tin cậy của chiến lược.
- Trong khi đó, các yếu tố khác nhau như giá cả, chỉ số và khối lượng giao dịch cũng được xem xét, làm cho tín hiệu mua và bán trở nên toàn diện và mạnh mẽ hơn.
- Thiết lập các điều kiện hạn chế phát sinh tín hiệu, tránh việc tạo ra các tín hiệu lặp đi lặp lại liên tục, giảm tín hiệu gây hiểu lầm.
Phân tích rủi ro
- Hiệu suất của chiến lược có thể bị ảnh hưởng bởi các thiết lập tham số như tỷ lệ phần trăm phạm vi giá, thời gian lùi, và cần điều chỉnh và tối ưu hóa tùy theo tình huống cụ thể.
- Các chỉ số EMA, VWAP và các chỉ số khác cũng có sự chậm trễ và hạn chế, và có thể không có hiệu lực trong một số môi trường thị trường.
- Chiến lược này được sử dụng chủ yếu cho các thị trường có xu hướng mạnh, có thể tạo ra nhiều tín hiệu giả trong thị trường biến động.
- Các biện pháp kiểm soát rủi ro của chiến lược tương đối đơn giản, thiếu các phương tiện quản lý rủi ro như dừng lỗ và quản lý vị trí.
Hướng tối ưu hóa
- Thêm nhiều chỉ số kỹ thuật và cảm xúc thị trường như RSI, MACD, và Binance để làm giàu quyết định chiến lược.
- Tối ưu hóa các điều kiện tạo ra tín hiệu mua và bán, tăng độ chính xác và độ tin cậy của tín hiệu. Có thể xem xét việc đưa ra phân tích trên nhiều khung thời gian, xác nhận hướng xu hướng.
- Thêm các biện pháp kiểm soát rủi ro như quản lý lỗ hổng và vị trí, thiết lập mức dừng lỗ và kích thước vị trí hợp lý, kiểm soát lỗ hổng rủi ro cho giao dịch đơn lẻ.
- Tối ưu hóa tham số và kiểm tra lại các chiến lược để tìm ra sự kết hợp tham số tối ưu và phạm vi áp dụng thị trường.
- Xem xét việc kết hợp chiến lược này với các chiến lược khác để tận dụng lợi thế của các chiến lược khác nhau và nâng cao tính ổn định và lợi nhuận tổng thể.
Tóm tắt
Chiến lược này được tạo ra bằng cách kết hợp các biểu đồ nóng giao dịch, giá cả trong thời gian thực và nhiều chỉ số kỹ thuật để tạo ra tín hiệu mua và bán, có giá trị tham chiếu nhất định. Ưu điểm của chiến lược là có thể hiển thị trực quan phân bố giá cả và khối lượng giao dịch và xem xét tổng hợp các yếu tố khác nhau để tạo ra tín hiệu. Tuy nhiên, chiến lược cũng có một số hạn chế và rủi ro, chẳng hạn như ảnh hưởng của cài đặt tham số, sự chậm trễ của chỉ số, phụ thuộc vào thị trường xu hướng. Do đó, trong ứng dụng thực tế, cần tối ưu hóa và hoàn thiện chiến lược hơn nữa, chẳng hạn như giới thiệu nhiều chỉ số, tối ưu hóa các điều kiện tín hiệu, tăng cường kiểm soát rủi ro, v.v. để nâng cao sự ổn định và khả năng lợi nhuận của chiến lược.
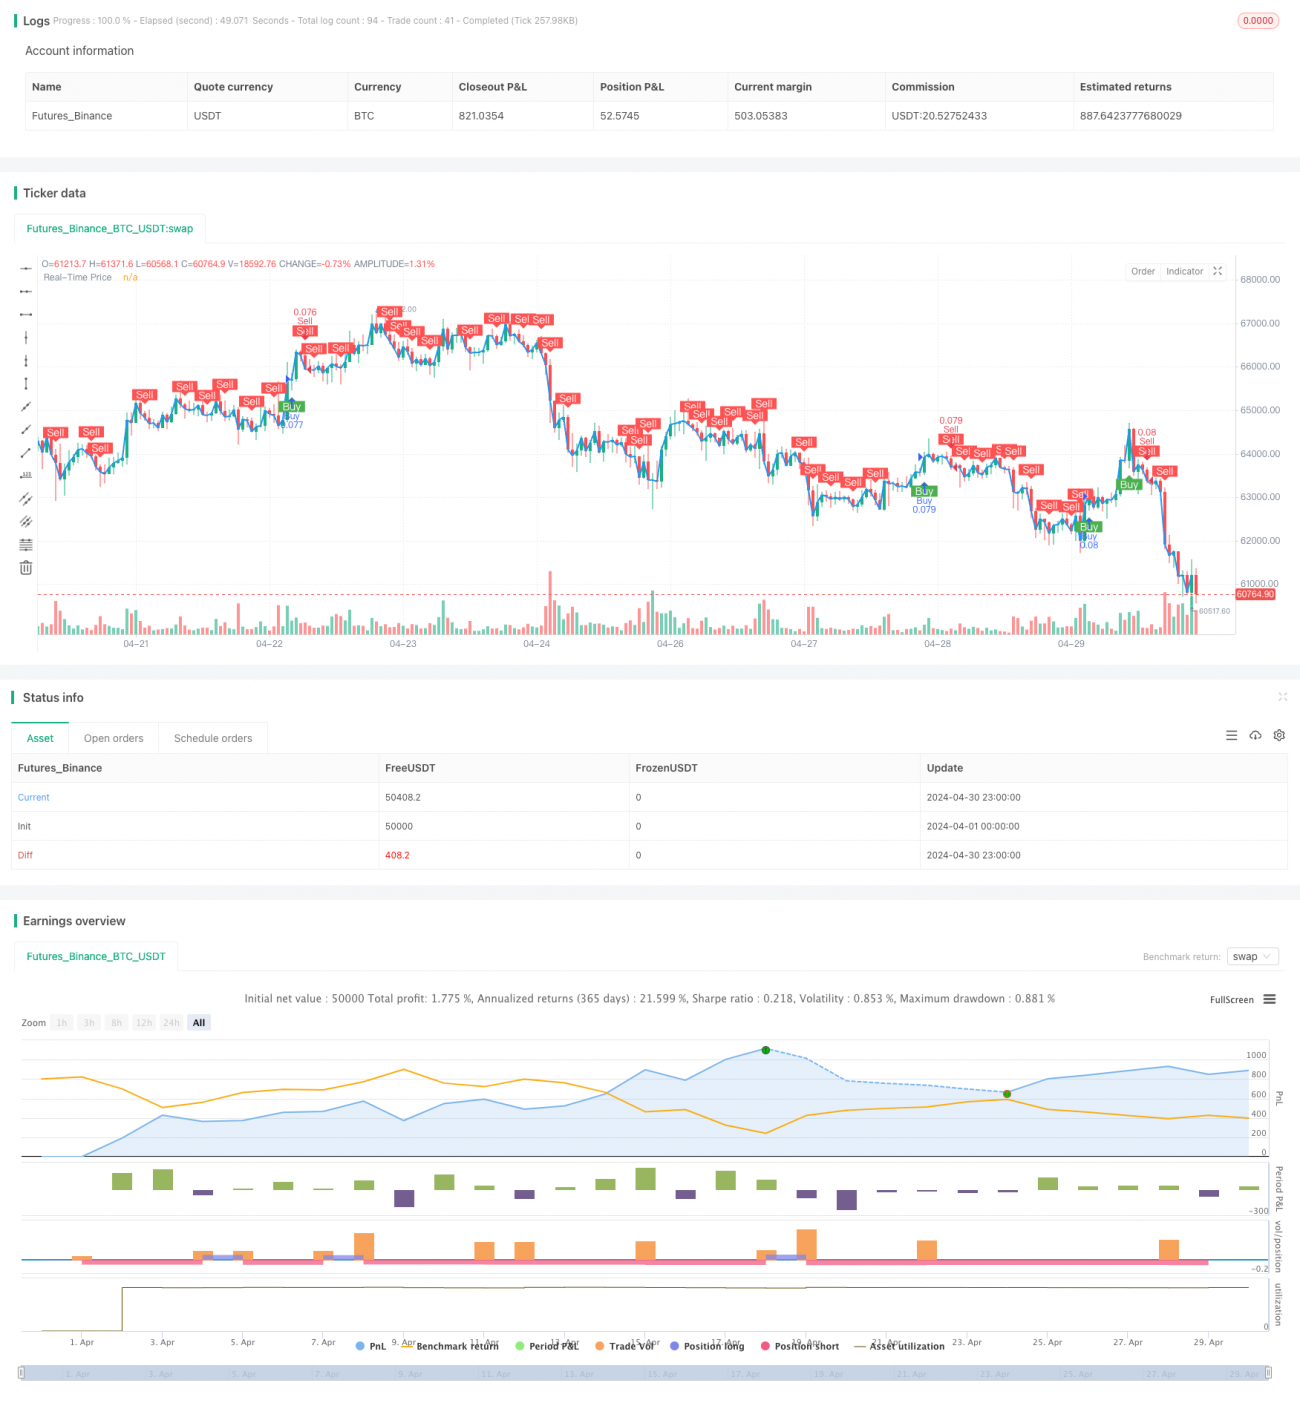
/*backtest
start: 2024-04-01 00:00:00
end: 2024-04-30 23:59:59
period: 1h
basePeriod: 15m
exchanges: [{"eid":"Futures_Binance","currency":"BTC_USDT"}]
*/

//@version=5
strategy("Buy and Sell Volume Heatmap with Real-Time Price Strategy", overlay=true, default_qty_type=strategy.percent_of_equity, default_qty_value=10)

// Settings for Volume Heatmap- 1