
1
Follow
1781
Followers
Tổng quan
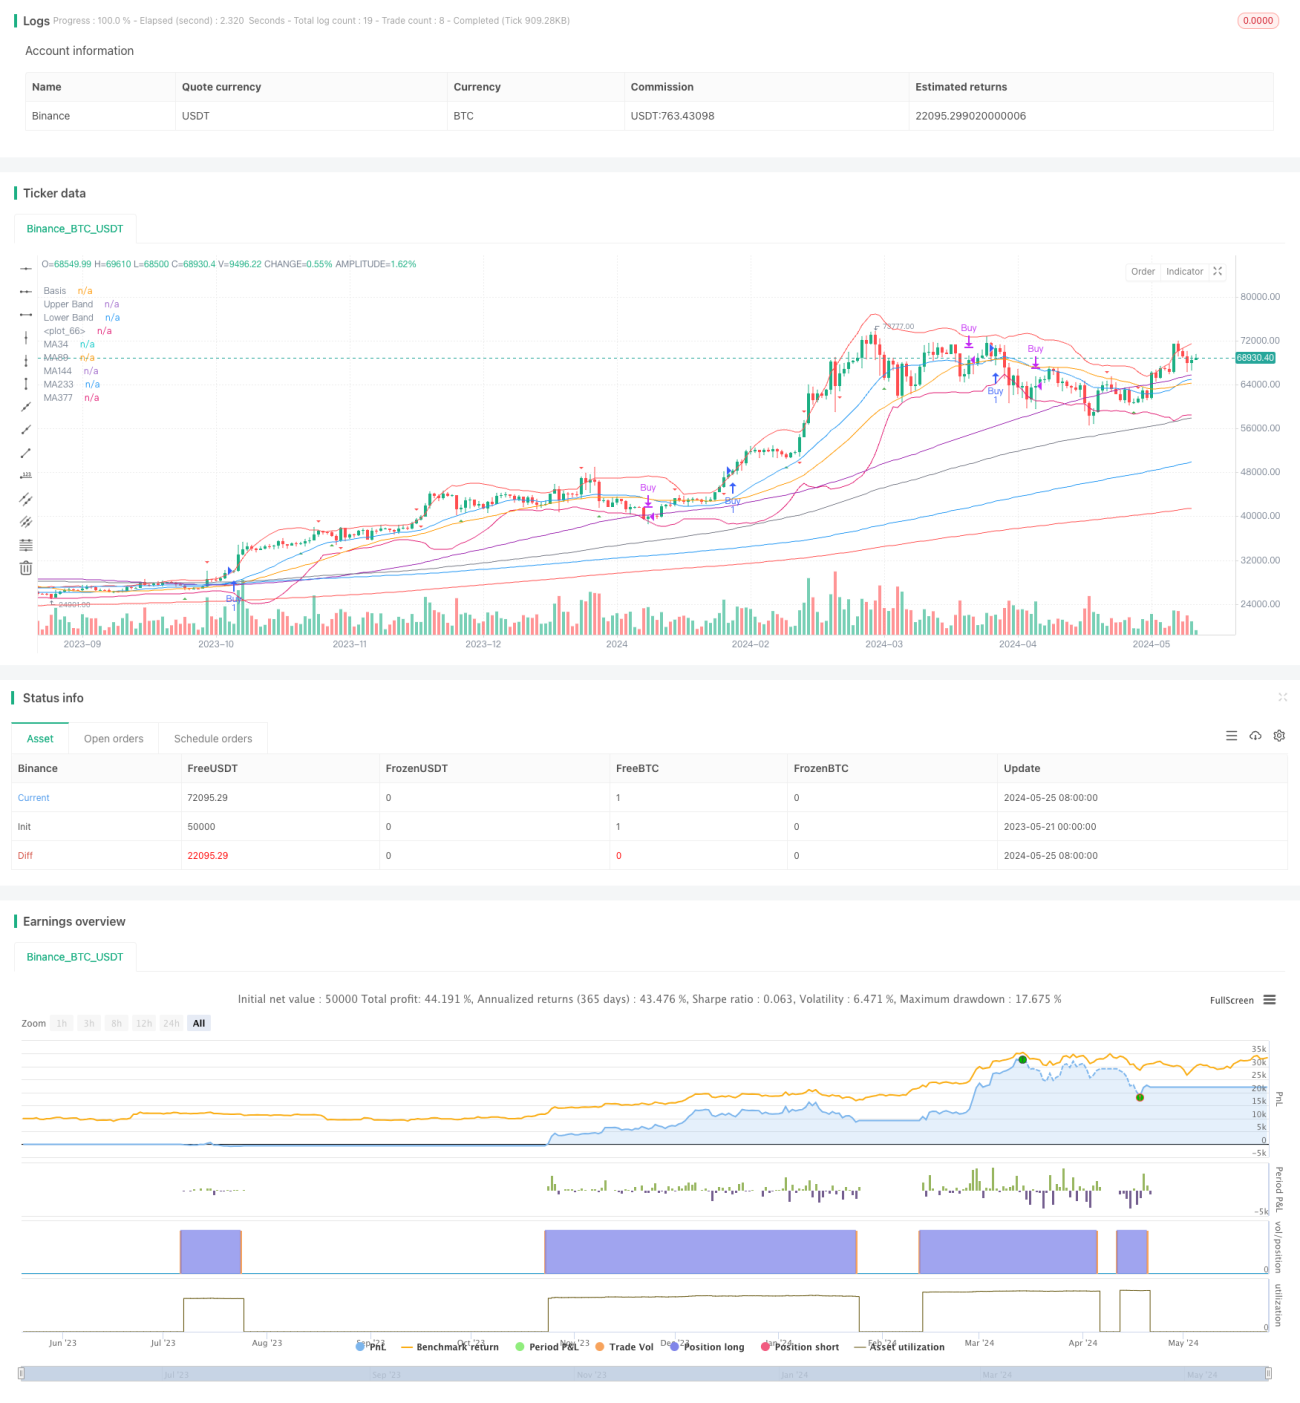
Chiến lược này kết hợp các chỉ số Brin, RSI, nhiều đường trung bình di chuyển và MACD để xây dựng một hệ thống giao dịch hoàn chỉnh. Đầu tiên, Brin sẽ đánh giá sự biến động của giá và sử dụng vị trí của giá so với đường trung tâm của Brin để xác định xu hướng. Đồng thời, sử dụng chỉ số RSI để đánh giá tình trạng quá mua quá bán, sử dụng RSI deviate để xác định xu hướng tiềm năng.
Nguyên tắc chiến lược
- Sử dụng 20 chu kỳ, 2 lần tiêu chuẩn kém hơn của Brin, để đánh giá xu hướng bằng cách đặt giá đóng cửa so với quỹ đạo của Brin.
- Tính toán RSI 14 chu kỳ và đánh giá quá bán và quá mua thông qua sự giao thoa của RSI với mức 30 và 70, để xác định sự đảo ngược tiềm năng.
- Tính trung bình di chuyển đơn giản cho các chu kỳ 34, 89, 144, 233, 377 và 610, xác nhận xu hướng bằng cách sắp xếp nhiều đầu của đường trung bình, đường trung bình cũng có thể được sử dụng làm ngưỡng kháng cự hỗ trợ.
- Tính toán MACD dựa trên các tham số 12, 26, 9 và hỗ trợ xác định sự đảo ngược xu hướng bằng cách kết nối các trục MACD với trục 0.
- Các chỉ số trên được đánh giá tổng hợp để đưa ra một logic mở lỗ hổng:
- Bắt đầu vị trí: Bắt đầu vị trí khi giá đóng cửa ở trên đường trung bình của Brin và đường trung bình ngắn hạn ở trên đường trung bình dài hạn.
- Vị thế đồng bằng: Vị thế bằng một nửa khi giá đóng cửa giảm xuống đường trung tâm của vùng Brin và toàn bộ khi đường trung bình ngắn hạn giảm xuống đường trung bình dài hạn.
Lợi thế chiến lược
- Brin Belt có thể định lượng khách quan sự biến động của giá cả, cung cấp cơ sở để đánh giá xu hướng.
- Việc đưa ra chỉ số RSI sẽ giúp đánh giá tình trạng buôn bán quá mức và nắm bắt cơ hội đảo ngược xu hướng tiềm ẩn.
- Sự kết hợp của nhiều đường trung bình cho phép phân tích toàn diện hơn về các xu hướng theo các quy mô thời gian.
- Chỉ số MACD có thể được sử dụng để đánh giá xu hướng và đảo ngược, tăng độ tin cậy của tín hiệu.
- Trong logic mở cửa vị trí mở, tư duy quản lý vị trí được thêm vào, giảm dần vị trí để kiểm soát rủi ro khi xu hướng không chắc chắn.
Rủi ro chiến lược
- Trong trường hợp xảy ra chấn động, các hệ thống liên tuyến và liên lằn có thể tạo ra các tín hiệu thường xuyên và mâu thuẫn.
- Các chỉ số RSI và MACD có thể tồn tại trong khu vực mua và bán quá mức trong một xu hướng mạnh và mất khả năng phán đoán.
- Lựa chọn tham số (ví dụ như chu kỳ vòng đai Brin, chu kỳ đường trung bình, v.v.) có tính chủ quan, các tham số khác nhau có thể mang lại kết quả khác nhau.
- Thiếu cơ chế ngăn chặn thiệt hại có thể làm tăng rủi ro của một giao dịch.
- Trong một số trường hợp, các nhà khoa học đã đưa ra các biện pháp phòng ngừa và điều trị cho các trường hợp cực đoan như thiên nga đen, nhưng không có khả năng đáp ứng kịp thời.
Hướng tối ưu hóa chiến lược
- Các tham số của các chỉ số được tối ưu hóa một cách có hệ thống hơn, chẳng hạn như chu kỳ và chiều rộng của dải Brin, chu kỳ và ngưỡng của RSI.
- Việc đưa ra nhiều tín hiệu xác nhận hơn, chẳng hạn như sự thay đổi khối lượng giao thông, giúp tăng độ tin cậy của tín hiệu.
- Giới thiệu các cơ chế dừng lỗ và dừng lại trong điều kiện mở lỗ để kiểm soát tốt hơn rủi ro giao dịch đơn lẻ.
- Cân nhắc giới thiệu cơ chế điều chỉnh vị trí, điều chỉnh vị trí linh hoạt trong các tình huống thị trường khác nhau, nâng cao tỷ lệ rủi ro lợi nhuận.
- Thiết kế đối phó với dự báo cho các tình huống cực đoan, chẳng hạn như bảo hiểm dựa trên chỉ số VIX hoặc trọng lượng động đối với yếu tố Alpha.
Tóm tắt
Chiến lược này xây dựng một hệ thống giao dịch tốt hơn từ nhiều khía cạnh, bao gồm phán đoán xu hướng, phán đoán mua quá mức, phân tích theo nhiều thời gian, kiểm soát vị trí. Tuy nhiên, chiến lược vẫn cần được tối ưu hóa để đối phó với tình huống biến động và tình huống cực đoan, và thiếu khả năng tối ưu hóa tham số và kiểm soát rủi ro có hệ thống hơn.
Source
Pine
Strategy parameters
Related strategies
Comment
All comments (0)
No data
- 1