Tổng quan
Chiến lược Pine Script dựa trên chỉ số RSI tương đối mạnh và chênh lệch chuẩn DEV của biến động giá, đánh giá điểm vào bằng cách so sánh giá với quỹ đạo lên xuống, đồng thời sử dụng RSI làm chỉ số lọc trợ giúp, tạo ra tín hiệu mở vị trí khi giá chạm quỹ đạo lên xuống và RSI đạt đến vùng vượt quá mua bán, đồng thời bình thường hóa vị trí khi giá đảo ngược thoát ra khỏi quỹ đạo hoặc RSI đảo ngược đạt đến vùng vượt quá mua bán. Chiến lược này có thể điều chỉnh động lực theo biến động của thị trường, giữ vị trí lợi nhuận khi biến động cao và dừng lỗ khi biến động thấp, là một chiến lược giao dịch định lượng có thể thích ứng với các trạng thái thị trường khác nhau.
Nguyên tắc chiến lược
- Tính giá dựa trên SMA và DEV của chu kỳ dài trước.
- Với SMA là trục trung tâm, SMA + thresholdEntry*DEV là đường ray, SMA-thresholdEntry*DEV đi xuống đường ray, tạo ra một kênh biến động.
- Đồng thời tính toán chỉ số RSI của giá đóng cửa mỗi chu kỳ rsiLength trong quá khứ.
- Một tín hiệu mở nhiều vị trí được tạo ra khi giá lên phá vỡ đường đi xuống và RSI nhỏ hơn rsiOversold.
- Khi giá phá vỡ đường đi xuống và RSI lớn hơn rsiOverbought, một tín hiệu mở kho được tạo ra.
- Với SMA là trục trung tâm, SMA + thresholdExit*DEV lên đường, SMA-thresholdExit*DEV đi xuống đường ray và xây dựng một lối thoát hẹp hơn.
- Khi giữ nhiều vị trí, nếu giá phá vỡ xuống và thoát khỏi đường mòn hoặc RSI lớn hơn ngưỡng mua, hãy bán nhiều vị trí.
- Khi giữ vị trí trống, nếu giá phá vỡ lên và thoát ra khỏi đường ray hoặc RSI nhỏ hơn ngưỡng bán tháo, vị trí trống là trống.
Phân tích lợi thế
- Trong khi đó, các chỉ số động lực và hành vi giá sẽ được sử dụng để lọc các tín hiệu giả.
- Chuyển đổi chiều rộng của kênh thông qua biến động của tỷ lệ biến động, cho phép chiến lược thích ứng với các tình trạng thị trường khác nhau.
- Thiết lập hai kênh, có thể dừng lỗ ngay khi giá đảo ngược, kiểm soát rút lui, và vẫn có thể giữ lợi nhuận sau khi xu hướng hình thành.
- Lập trình logic và tham số được thiết lập rõ ràng, dễ hiểu và tối ưu hóa.
Phân tích rủi ro
- Khi thị trường tiếp tục chạy theo xu hướng một chiều, chiến lược này có thể dừng lỗ sớm và mất lợi nhuận theo xu hướng.
- Cài đặt tham số có ảnh hưởng lớn đến hiệu suất của chiến lược và cần tối ưu hóa tham số cho các giống và chu kỳ khác nhau.
- Chiến lược này có lợi thế hơn trong thị trường chấn động, thị trường xu hướng thường hoạt động. Nếu xu hướng dài hạn đột ngột đảo ngược, chiến lược này có thể tạo ra sự rút lui lớn hơn.
- Nếu tỷ lệ biến động của tài sản của chỉ số thay đổi mạnh, các thiết lập tham số cố định có thể sẽ không có hiệu lực.
Hướng tối ưu hóa
- Bạn có thể thử giới thiệu các chỉ số định xu hướng, chẳng hạn như đường trung bình dài hạn, ADX, để phân biệt giữa xu hướng và thị trường rung động, sử dụng các tham số khác nhau.
- Xem xét sử dụng các chỉ số tỷ lệ dao động có khả năng thích ứng hơn, chẳng hạn như ATR, để điều chỉnh động chiều rộng kênh tỷ lệ dao động.
- Trước khi mở vị trí, hãy đánh giá xu hướng về xu hướng của giá, để phát hiện xem có xu hướng rõ ràng hay không, và tránh giao dịch ngược.
- Có thể sử dụng các thuật toán di truyền, tìm kiếm lưới và các phương pháp khác nhau để tối ưu hóa các tổ hợp tham số khác nhau để tìm thiết lập tham số tối ưu.
- Hãy xem xét sử dụng các thiết lập tham số khác nhau cho các vị trí nhiều đầu và trống để kiểm soát lỗ hổng rủi ro.
Tóm tắt
Chiến lược này thông qua các kênh biến động và chỉ số tương đối mạnh mẽ kết hợp với các biện pháp mở và mở vị trí bằng cách tham khảo các chỉ số RSI đồng thời với biến động giá, có thể nắm bắt được xu hướng giai đoạn tốt hơn, dừng lỗ và lợi nhuận kết thúc đúng thời gian. Tuy nhiên, hiệu suất của chiến lược là nhạy cảm với các tham số thiết lập, cần phải được tối ưu hóa cho các môi trường thị trường khác nhau và các tài sản được đánh giá, đồng thời xem xét đưa ra các chỉ số khác về xu hướng thị trường để đưa ra phán đoán phụ trợ để tận dụng tối đa lợi thế của chiến lược.
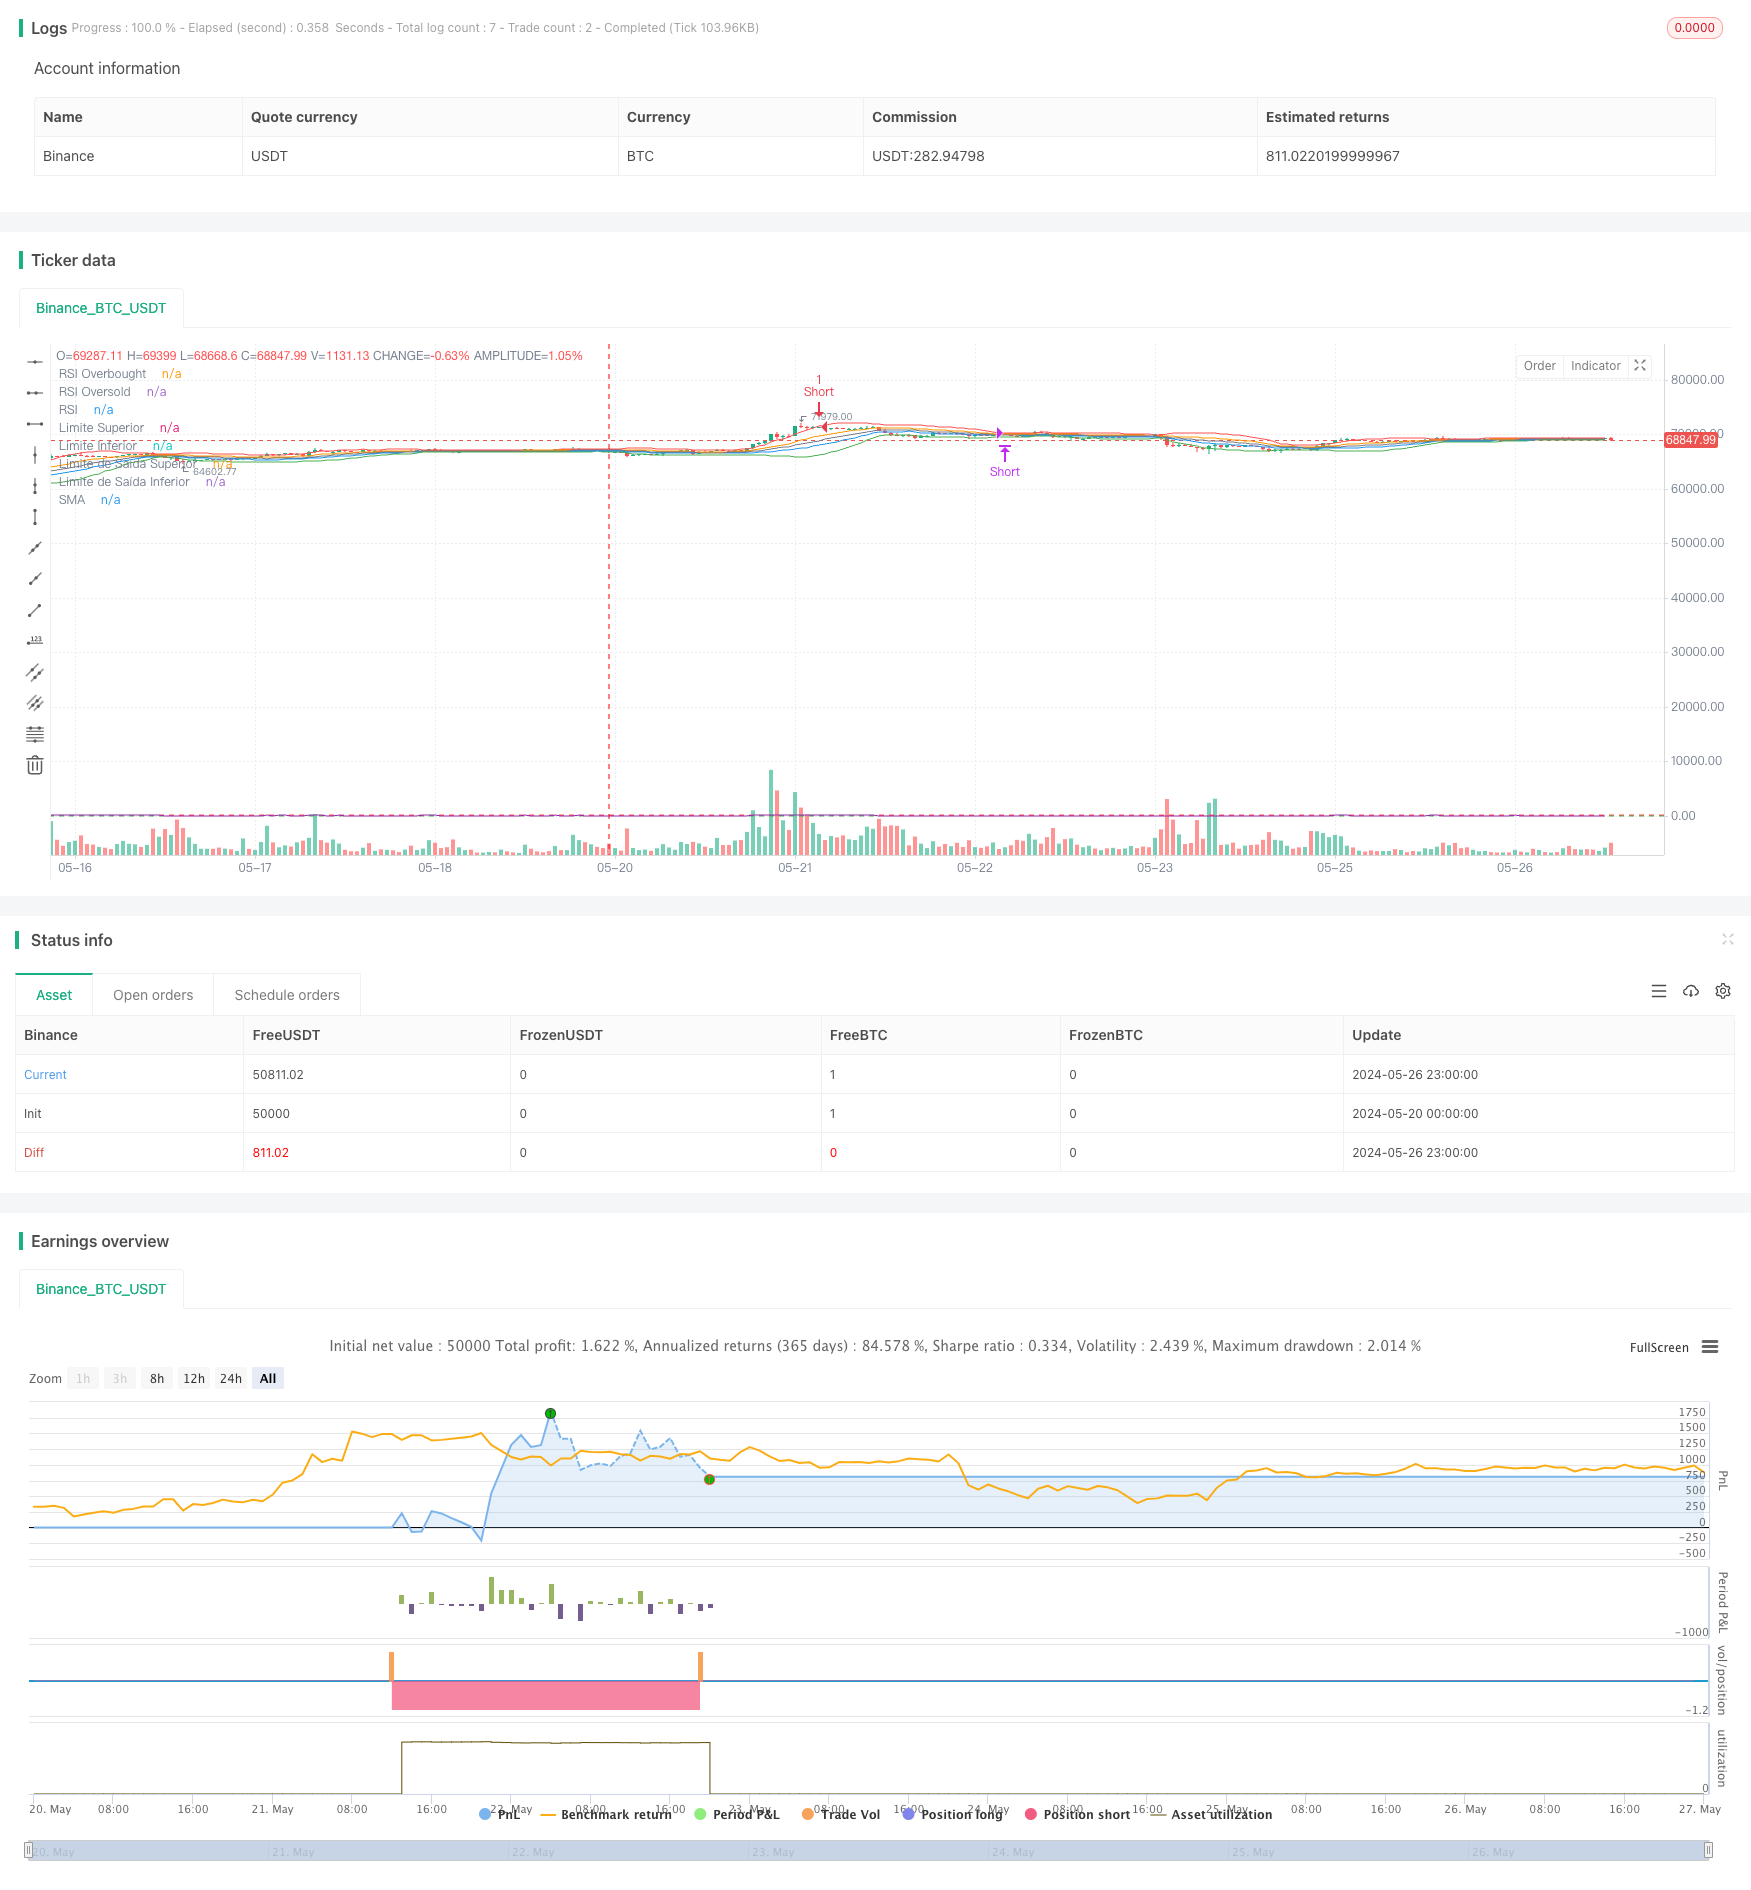
/*backtest
start: 2024-05-20 00:00:00
end: 2024-05-27 00:00:00
period: 1h
basePeriod: 15m
exchanges: [{"eid":"Binance","currency":"BTC_USDT"}]
*/

// This Pine Script™ code is subject to the terms of the Mozilla Public License 2.0 at https://mozilla.org/MPL/2.0/
// © tmalvao

//@version=5
strategy("Estratégia de Desvio Padrão com RSI", overlay=true, margin_long=100, margin_short=100)

// Parâmetros
length = input.int(20, title="Período do Desvio Padrão")
thresholdEntry = input.float(1.5, title="Limite de Entrada")
thresholdExit = input.float(0.5, title="Limite de Saída")
rsiLength = input.int(14, title="Período do RSI")
rsiOverbought = input.int(70, title="RSI Overbought")
rsiOversold = input.int(30, title="RSI Oversold")

// Cálculo do Desvio Padrão
price = close
stdDev = ta.stdev(price, length)

// Média Móvel Simples
sma = ta.sma(price, length)

// Limites baseados no Desvio Padrão
upperLimit = sma + thresholdEntry * stdDev
lowerLimit = sma - thresholdEntry * stdDev
exitUpperLimit = sma + thresholdExit * stdDev
exitLowerLimit = sma - thresholdExit * stdDev

// Cálculo do RSI
rsi = ta.rsi(price, rsiLength)

// Condições de Entrada com RSI
longCondition = ta.crossover(price, lowerLimit) and rsi < rsiOversold
shortCondition = ta.crossunder(price, upperLimit) and rsi > rsiOverbought

// Condições de Saída com RSI
exitLongCondition = ta.crossunder(price, exitLowerLimit) or rsi > rsiOverbought
exitShortCondition = ta.crossover(price, exitUpperLimit) or rsi < rsiOversold

// Plotar Linhas
plot(upperLimit, color=color.red, title="Limite Superior")
plot(lowerLimit, color=color.green, title="Limite Inferior")
plot(exitUpperLimit, color=color.orange, title="Limite de Saída Superior")
plot(exitLowerLimit, color=color.blue, title="Limite de Saída Inferior")
plot(sma, color=color.gray, title="SMA")
hline(rsiOverbought, "RSI Overbought", color=color.red)
hline(rsiOversold, "RSI Oversold", color=color.green)
plot(rsi, title="RSI", color=color.purple)

// Estratégia de Trade
if (longCondition)
    strategy.entry("Long", strategy.long)

if (shortCondition)
    strategy.entry("Short", strategy.short)

if (exitLongCondition)
    strategy.close("Long")

if (exitShortCondition)
    strategy.close("Short")