
Tổng quan
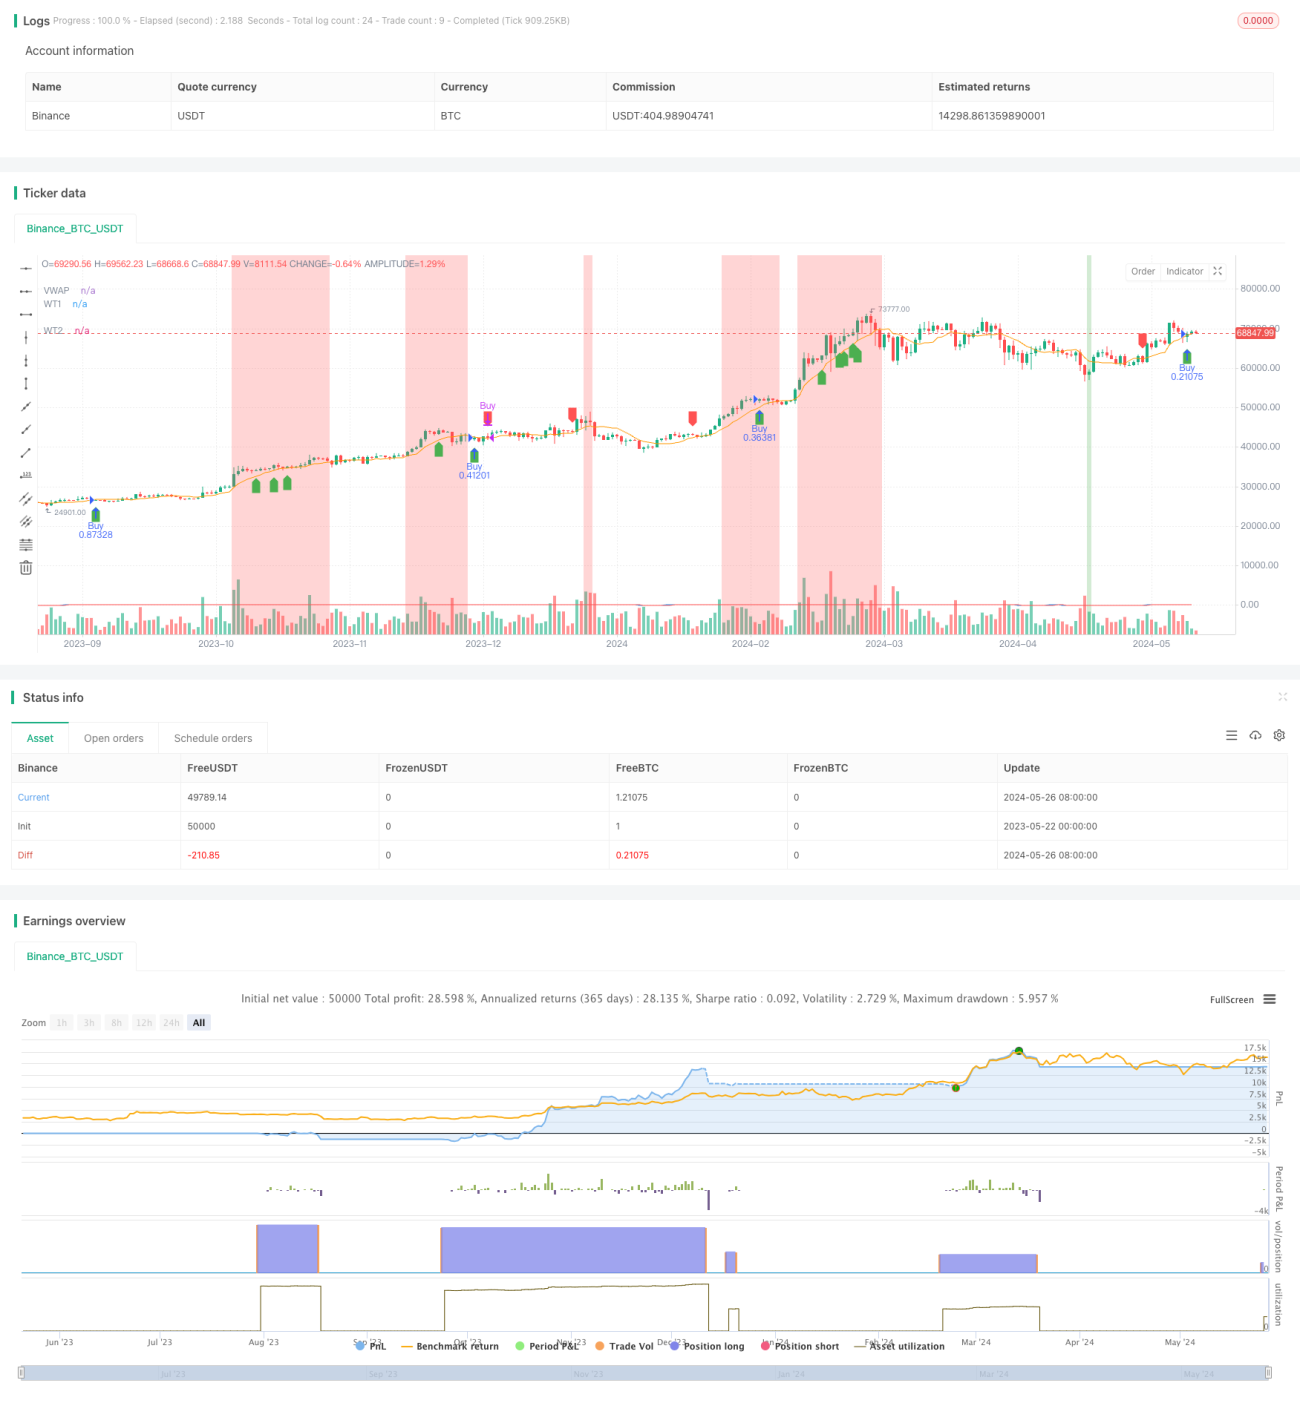
PipShiesty Swagger là một chiến lược giao dịch kỹ thuật được thiết kế riêng cho TradingView. Chiến lược này sử dụng chỉ số biến động WaveTrend (WT) và giá trung bình trọng lượng giao dịch (VWAP) để xác định tín hiệu giao dịch tiềm năng, quản lý rủi ro và hình dung các điều kiện quá mua và quá bán trên biểu đồ giá. Chiến lược này sử dụng một loạt các chỉ số để tính toán chỉ số biến động EMA và tạo ra đường tín hiệu thông qua đường trung bình di chuyển đơn giản (SMA) để xác nhận tín hiệu giao dịch và lọc tiếng ồn.
Nguyên tắc chiến lược
Trung tâm của chiến lược PipShiesty Swagger là chỉ số WaveTrend oscillating (WT) và giá trung bình cân bằng khối lượng giao dịch (VWAP). WT sử dụng chiều dài kênh và chiều dài trung bình là hai tham số chính, và áp dụng moving average (EMA) cho giá trung bình thông qua một loạt các chỉ số.
Lợi thế chiến lược
- Chiến lược PipShiesty Swagger kết hợp nhiều chỉ số kỹ thuật như chỉ số biến động WaveTrend, VWAP và ATR để cung cấp phân tích thị trường toàn diện.
- Chiến lược này có thể nhận diện được các biến động tiềm năng của đợt giảm giá và đợt giảm giá, cung cấp cho các nhà giao dịch cơ hội giao dịch tiềm năng.
- Bằng cách xác định mức độ quá mua và quá bán, chiến lược này có thể giúp các nhà giao dịch xác định các điểm biến động thị trường tiềm năng.
- Chiến lược này bao gồm các tham số quản lý rủi ro, chẳng hạn như tỷ lệ phần trăm rủi ro cho mỗi giao dịch và nhân số dừng lỗ dựa trên ATR, giúp quản lý rủi ro và bảo vệ vốn.
- Chiến lược này cung cấp các chỉ dẫn trực quan rõ ràng trên biểu đồ, chẳng hạn như chỉ số biến động WaveTrend, đường tín hiệu, VWAP và màu nền, cho phép thương nhân dễ dàng giải thích tình trạng thị trường.
Rủi ro chiến lược
- Chiến lược PipShiesty Swagger phụ thuộc vào các chỉ số kỹ thuật có thể tạo ra tín hiệu sai lệch, đặc biệt là khi thị trường biến động lớn hoặc xu hướng không rõ ràng.
- Hiệu suất của chiến lược này có thể bị ảnh hưởng bởi sự lựa chọn tham số, chẳng hạn như chiều dài kênh, chiều dài trung bình và mức độ quá mua / quá bán. Thiết lập tham số không phù hợp có thể dẫn đến kết quả ưu tiên thứ cấp.
- Mặc dù chiến lược này bao gồm các tham số quản lý rủi ro, nhưng vẫn có nguy cơ mất vốn tiềm ẩn, đặc biệt là trong thời gian thị trường biến động mạnh.
- Chiến lược này chủ yếu tập trung vào biểu đồ 15 phút của BTC, có thể không nắm bắt được những biến động thị trường quan trọng trong các phạm vi thời gian khác.
Hướng tối ưu hóa chiến lược
- Cân nhắc kết hợp các chỉ số kỹ thuật khác hoặc chỉ số cảm xúc thị trường để tăng độ tin cậy và độ chính xác của tín hiệu.
- Phân tích tối ưu hóa và nhạy cảm đối với các tham số chính sách để xác định thiết lập tốt nhất và cải thiện hiệu suất chính sách.
- Tham gia các cơ chế dừng và dừng động để quản lý rủi ro tốt hơn và tối đa hóa lợi nhuận tiềm năng.
- Mở rộng chiến lược này sang các phạm vi thời gian và các công cụ giao dịch khác để nắm bắt cơ hội thị trường rộng hơn.
Tóm tắt
PipShiesty Swagger là một chiến lược giao dịch kỹ thuật mạnh mẽ, được thiết kế dành riêng cho biểu đồ 15 phút BTC trên TradingView. Nó sử dụng chỉ số biến động WaveTrend và VWAP để xác định tín hiệu giao dịch tiềm năng, đồng thời kết hợp các tham số quản lý rủi ro để bảo vệ vốn. Mặc dù chiến lược này cho thấy triển vọng, nhưng các nhà giao dịch vẫn cần thận trọng khi thực hiện và xem xét các chiến lược tối ưu hóa để nâng cao hiệu suất và khả năng thích ứng của nó.
- 1