Chiến lược giao dịch đảo ngược xu hướng dựa trên phân kỳ RSI

Tổng quan
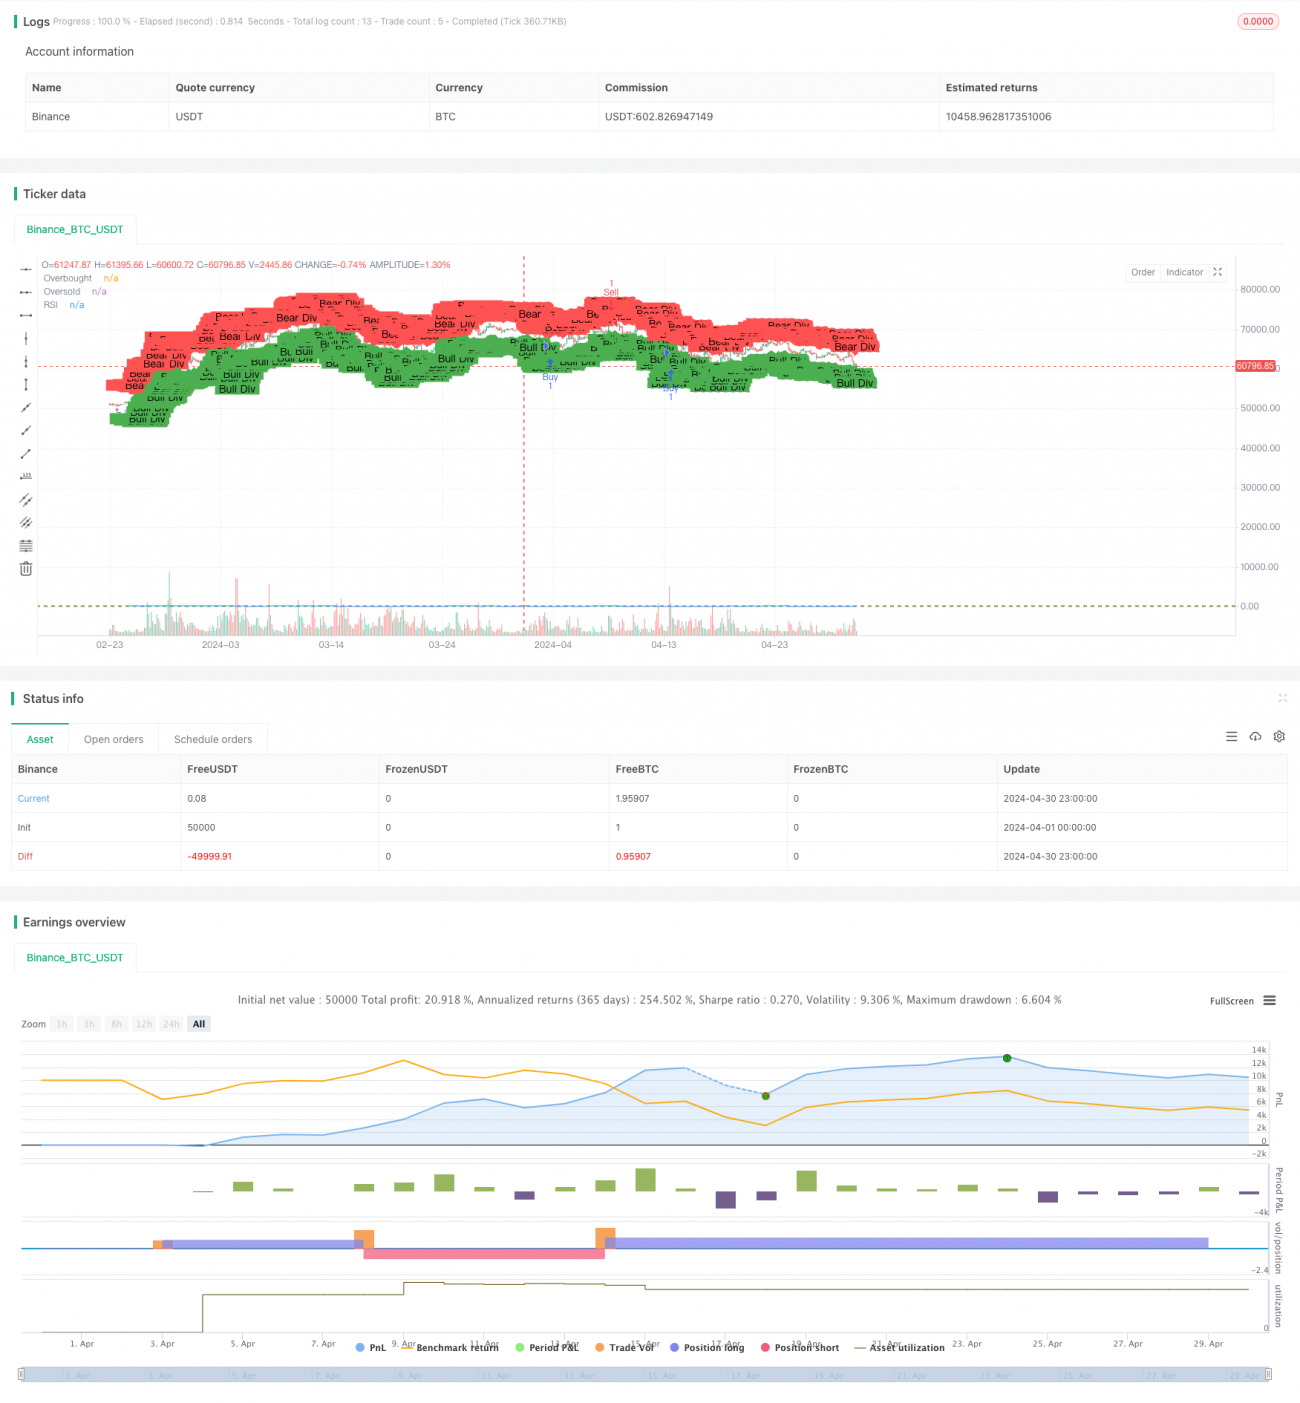
Chiến lược giao dịch này dựa trên sự khác biệt giữa chỉ số tương đối mạnh (RSI) và sự chuyển động của giá, nhằm mục đích nắm bắt cơ hội đảo ngược xu hướng tiềm năng. Chiến lược này tạo ra tín hiệu mua và bán bằng cách phát hiện sự khác biệt đa đầu và trái đầu, tương ứng. Khi RSI và giá xuất hiện, cho thấy xu hướng hiện tại có thể sắp đảo ngược, cung cấp cho nhà giao dịch cơ hội giao dịch tiềm năng.
Nguyên tắc chiến lược
- Tính toán chỉ số RSI trong chu kỳ được chỉ định.
- Bằng cách so sánh giá và RSI trong một khoảng thời gian nhất định trong quá khứ, để xác định xem có sự lệch nhiều đầu hay không.
- Nhiều người quay lưng lại: Giá sáng tạo thấp, nhưng RSI không sáng tạo thấp, cho thấy năng lượng tăng đang tích lũy.
- Trở về phía trước: Giá đã tăng cao, nhưng RSI đã không tăng cao, cho thấy động lực giảm đang tích lũy.
- Một tín hiệu mua sẽ được tạo ra khi xác định sự lệch đa đầu và RSI từ vùng bán tháo vượt qua.
- Một tín hiệu bán ra được tạo ra khi đầu không được phát hiện và RSI từ vùng quá mua đã vượt qua và trở lại.
Lợi thế chiến lược
- Ghi nhận xu hướng đảo ngược: Bằng cách nhận biết RSI và sự khác biệt của giá, chiến lược có thể tạo ra tín hiệu giao dịch ngay khi xu hướng đảo ngược, cung cấp cho các nhà giao dịch cơ hội sắp xếp trước.
- Dễ sử dụng: Chiến lược dựa trên chỉ số RSI cổ điển, tính toán đơn giản, tham số dễ hiểu và điều chỉnh, phù hợp cho tất cả các loại thương nhân sử dụng.
- Có thể áp dụng cho nhiều thị trường: Chiến lược RSI có thể được áp dụng cho các thị trường tài chính khác nhau, chẳng hạn như cổ phiếu, tương lai, ngoại hối, và có khả năng áp dụng rộng rãi.
Rủi ro chiến lược
- Tín hiệu giả: Không phải tất cả các biến động RSI sẽ dẫn đến sự đảo ngược xu hướng thực tế, đôi khi tín hiệu giả sẽ dẫn đến tổn thất giao dịch.
- Trở lại: RSI biến thường xảy ra trong giai đoạn đầu của xu hướng đảo ngược, nhưng không phải tất cả các tín hiệu biến mất có thể gây ra sự đảo ngược xu hướng ngay lập tức, có thể có một sự chậm trễ.
- Nhận thức tham số: Hiệu suất của chiến lược có thể nhạy cảm với các tham số như chu kỳ tính toán RSI, giá trị thềm quá mua quá bán, và các thiết lập tham số khác nhau có thể dẫn đến kết quả giao dịch khác nhau.
Hướng tối ưu hóa chiến lược
- Kết hợp với các chỉ số khác: sử dụng RSI ngoài chiến lược kết hợp với các chỉ số kỹ thuật khác (như trung bình di chuyển, MACD, v.v.) để tăng độ tin cậy xác nhận tín hiệu.
- Các tham số điều chỉnh động: tùy thuộc vào tình trạng thị trường và đặc điểm tài sản, điều chỉnh động các tham số như chu kỳ tính toán RSI, mua quá giá và bán quá giá để phù hợp với môi trường thị trường khác nhau.
- Tham gia quản lý rủi ro: đưa ra các cơ chế dừng và ngăn chặn trong chiến lược, kiểm soát rủi ro giao dịch đơn lẻ, tăng thu nhập sau khi điều chỉnh rủi ro của chiến lược.
- Phân tích đa thang thời gian: Phân tích RSI trên các thang thời gian khác nhau (như đường mặt trời, đường 4 giờ, v.v.) để nắm bắt cơ hội đảo ngược xu hướng ở các cấp khác nhau.
Tóm tắt
Chiến lược giao dịch đảo ngược xu hướng dựa trên RSI bằng cách nắm bắt hiện tượng đảo ngược xu hướng giữa chỉ số RSI và xu hướng giá, xác định cơ hội đảo ngược xu hướng tiềm năng. Chiến lược đơn giản, dễ sử dụng và phù hợp với nhiều thị trường tài chính. Tuy nhiên, các nhà giao dịch cần chú ý đến các yếu tố rủi ro như tín hiệu giả, chậm trễ và nhạy cảm với tham số.
- 1