
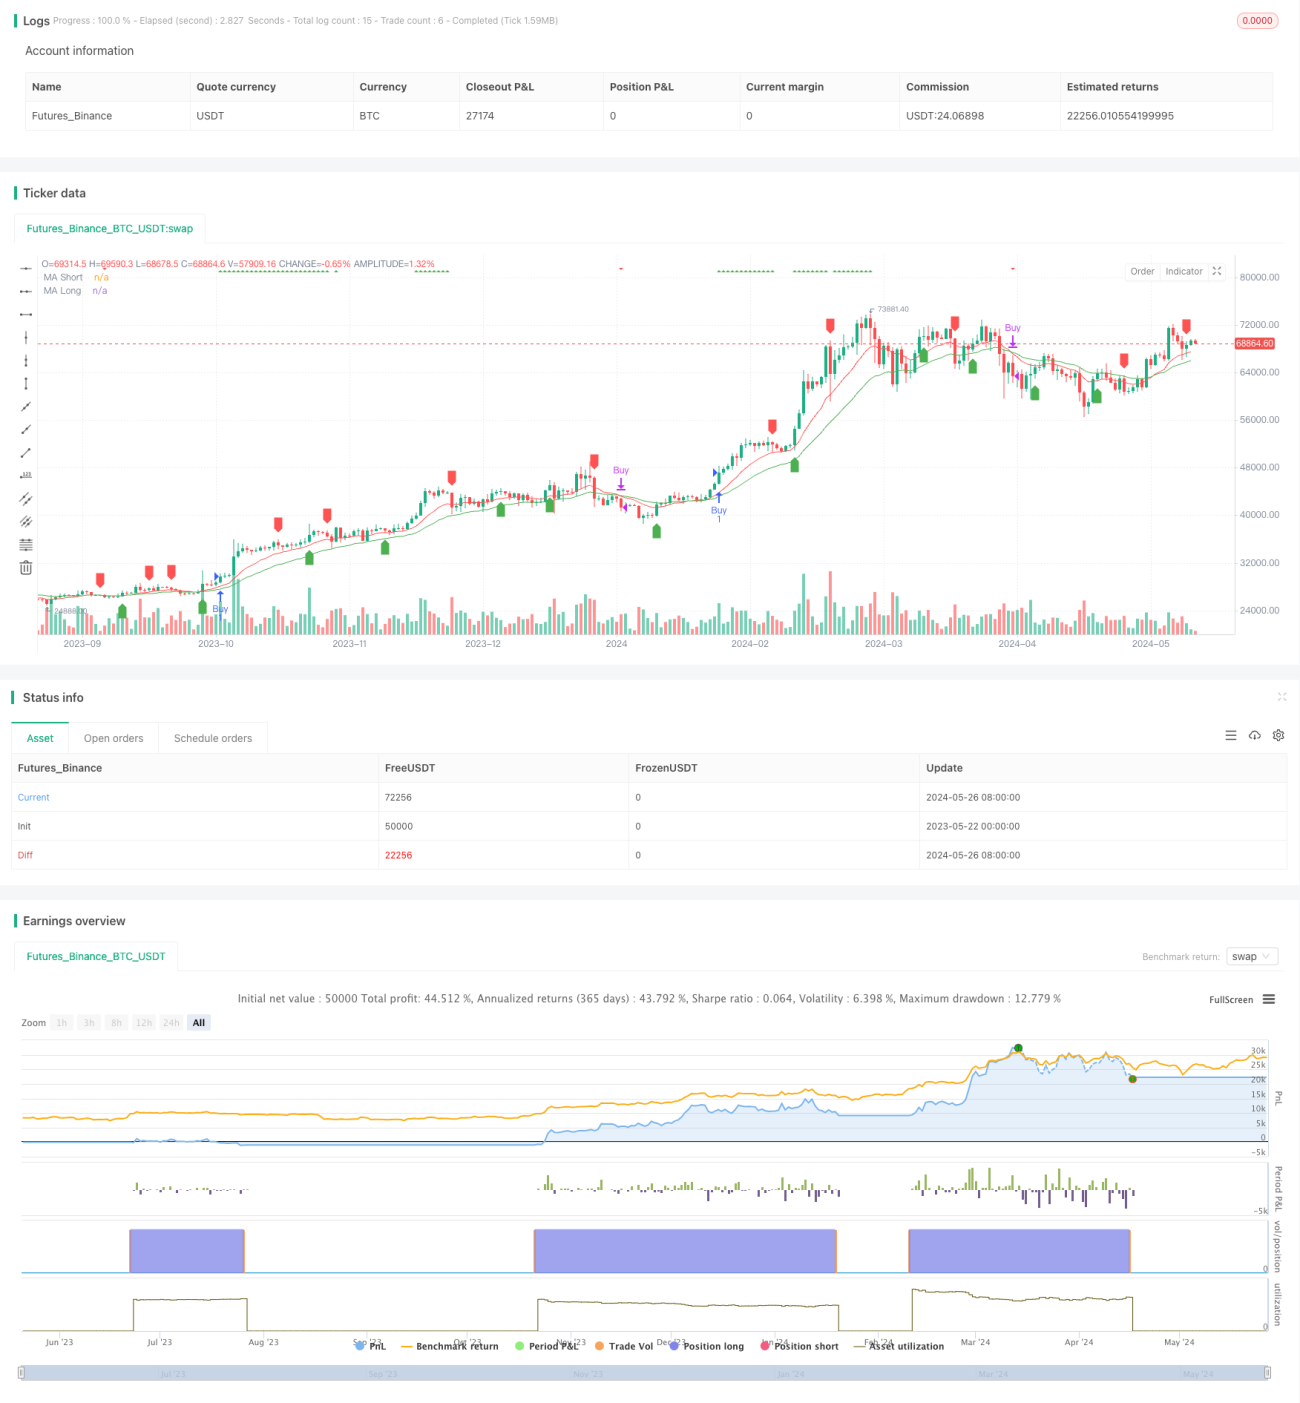
Tổng quan
Chiến lược này kết hợp các chỉ số RSI với đường trung bình di chuyển ((MA) để tạo ra tín hiệu giao dịch. RSI được sử dụng để xác định thị trường có quá mua hay quá bán hay không, MA được sử dụng để xác định xu hướng giá. RSI tạo ra tín hiệu mua khi RSI quá mua và giá cao hơn MA; và tín hiệu bán khi RSI quá bán hoặc MA tạo ra một cái chết.
Nguyên tắc chiến lược
- Tính toán RSI để xác định thị trường đang mua quá mức (<70) hoặc bán quá mức (<30).
- Tính toán MA theo chu kỳ tùy chỉnh, bao gồm bốn loại EMA, SMA, HMA và WMA, và quyết định hiển thị trên biểu đồ dựa trên cài đặt tham số.
- Khi RSI mua quá mức và giá đóng cửa cao hơn MA, tạo ra tín hiệu mua; khi RSI bán quá mức hoặc MA tạo ra một cái chết, tạo ra tín hiệu bán.
- Tham gia chỉ số StochRSI như một phán đoán hỗ trợ, StochRSI sẽ đánh dấu các gợi ý trên biểu đồ khi quá mua (<70) hoặc quá bán (<30), nhưng không tạo ra tín hiệu giao dịch thực tế.
Lợi thế chiến lược
- RSI và MA là hai chỉ số cổ điển được kết hợp một cách hữu cơ để nắm bắt tốt hơn các xu hướng và thời điểm mua và bán.
- Loại MA và tham số có thể được thiết lập tự do, linh hoạt hơn, có thể được điều chỉnh theo các đặc điểm thị trường khác nhau.
- Các chỉ số StochRSI được giới thiệu như một phán đoán hỗ trợ, cung cấp thêm tài liệu tham khảo cho các quyết định giao dịch.
- Khóa mã có logic rõ ràng, dễ đọc, dễ hiểu và phát triển thứ hai.
Rủi ro chiến lược
- RSI và MA đều là các chỉ số bị tụt hậu, có thể tạo ra nhiều tín hiệu sai lệch trong giai đoạn đầu của xu hướng đảo ngược.
- Thiết lập tham số không đúng có thể gây ra tín hiệu quá sớm hoặc quá muộn, ảnh hưởng đến thu nhập tổng thể.
- Thiếu quản lý lỗ hổng và vị trí, có thể chịu rủi ro lớn hơn khi thị trường biến động mạnh.
Hướng tối ưu hóa chiến lược
- Tiếp tục giới thiệu thêm các chỉ số tiên tiến như tỷ lệ biến động để đánh giá trước sự thay đổi xu hướng.
- Các tín hiệu mua và bán được lọc, chẳng hạn như yêu cầu RSI và MA đáp ứng cùng một điều kiện nhất định để tạo ra tín hiệu, để tăng độ chính xác của tín hiệu.
- Thêm mô-đun quản lý lỗ hổng và vị trí vào chiến lược, kiểm soát rủi ro giao dịch đơn lẻ và rủi ro tổng thể.
- Tối ưu hóa tham số cho chiến lược, tìm kiếm sự kết hợp tham số tốt nhất.
- Xem xét thêm các chu kỳ khác nhau hoặc nhiều giống, tận dụng tối đa mối quan hệ liên kết giữa các giống hoặc chu kỳ.
Tóm tắt
Chiến lược này kết hợp hai chỉ số cổ điển RSI và MA, có thể nắm bắt thời điểm xu hướng và mua quá bán, đồng thời đưa ra chỉ số StochRSI làm phán đoán phụ trợ, suy nghĩ tổng thể đơn giản và rõ ràng. Tuy nhiên, chiến lược cũng có một số thiếu sót, chẳng hạn như thiếu các biện pháp kiểm soát rủi ro, độ chính xác của tín hiệu cần được cải thiện. Trong tương lai, chiến lược có thể được hoàn thiện bằng cách giới thiệu nhiều chỉ số, tối ưu hóa quy tắc tín hiệu, thêm mô-đun kiểm soát rủi ro, v.v.
- 1