Chiến lược tối ưu hóa cơ chế thị trường dài hạn-ngắn hạn dựa trên biến động và đường hồi quy

1
Follow
1781
Followers
Tổng quan
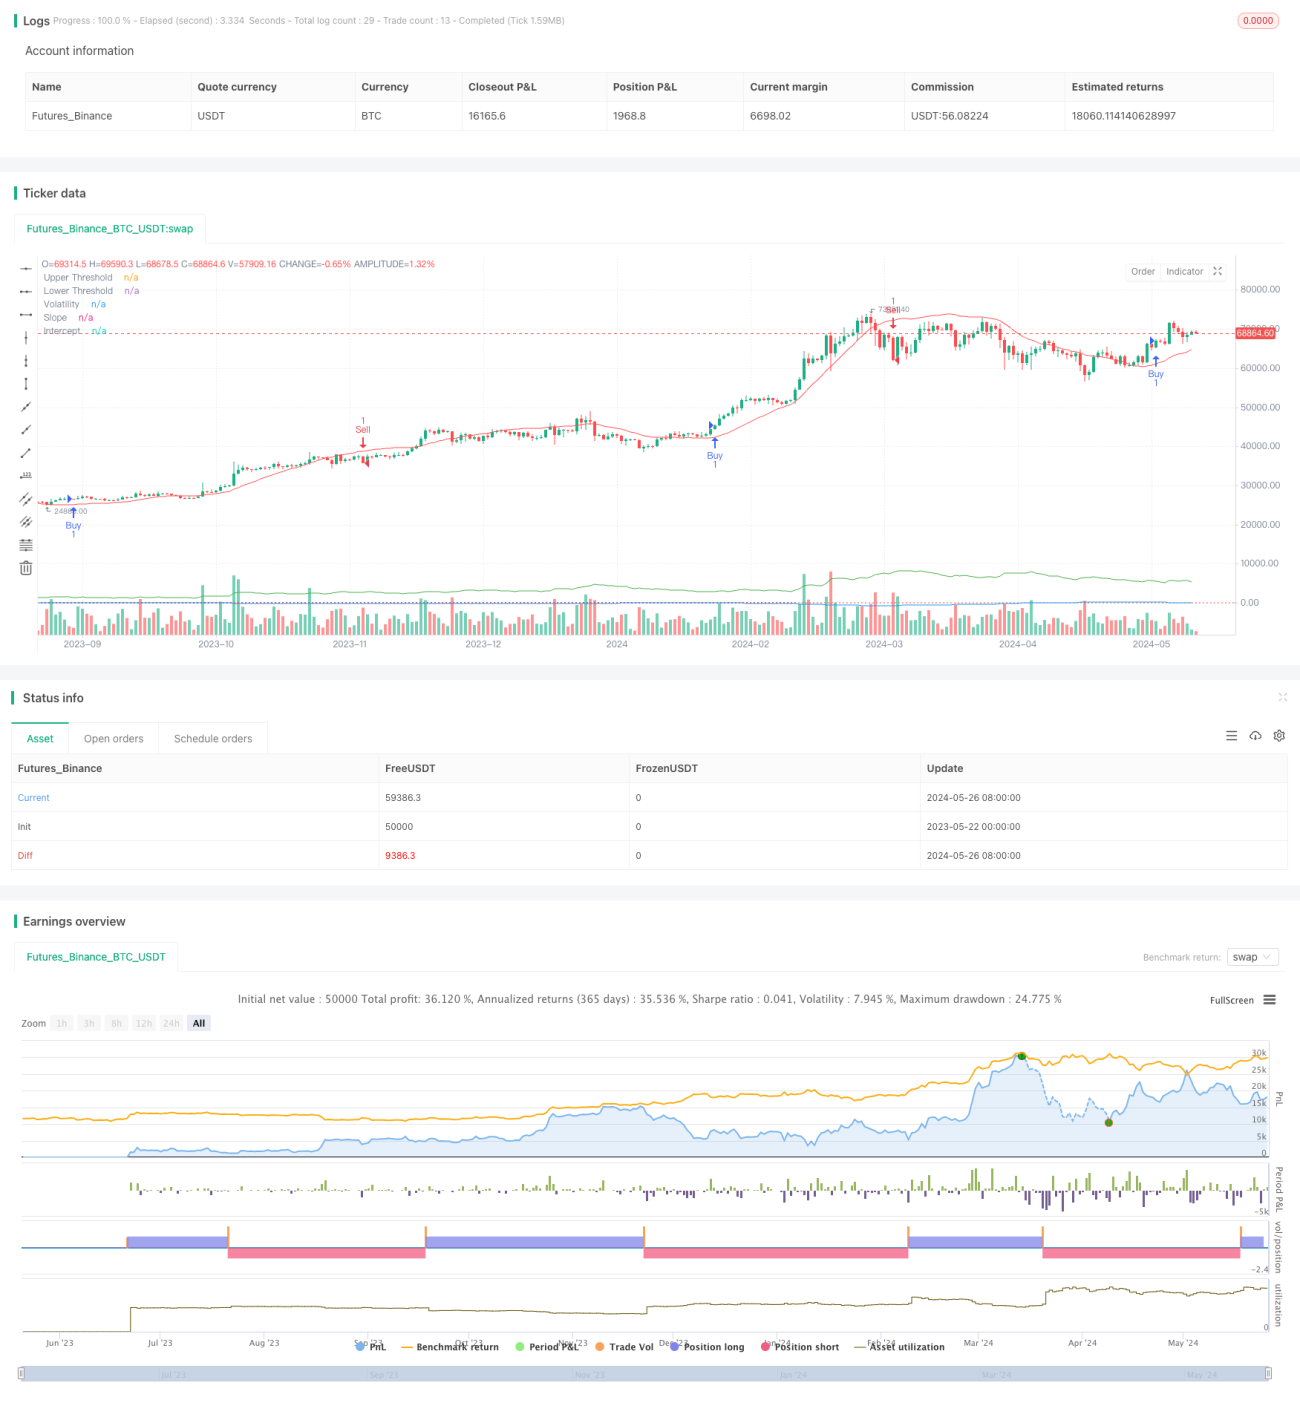
Chiến lược này sử dụng chỉ số hồi phục tuyến tính và biến động để xác định các trạng thái thị trường khác nhau, và khi đáp ứng các điều kiện mua hoặc bán, chiến lược sẽ thiết lập vị trí đầu tư hoặc vị trí đầu tư trống tương ứng. Đồng thời, chiến lược này cho phép tối ưu hóa và điều chỉnh các tham số theo tình trạng thị trường để phù hợp với các môi trường thị trường khác nhau.
Nguyên tắc chiến lược
- Tính phân đoạn và độ lệch của sự hồi phục tuyến tính để xác định xu hướng thị trường.
- Tính toán tỷ lệ biến động thực trung bình ((ATR) nhân với nhân là chỉ số biến động.
- Một tín hiệu mua được tạo ra khi độ lệch lớn hơn giá tăng và giá cao hơn đường quay trở lại cộng với tỷ lệ biến động.
- Một tín hiệu bán ra được tạo ra khi độ dốc nhỏ hơn ngưỡng giảm và giá thấp hơn đường quay trở lại trừ đi tỷ lệ biến động.
- Sử dụng chỉ số di chuyển trung bình nhanh và chậm (EMA) như một chỉ số xác nhận bổ sung.
- Xây dựng một vị trí nhiều đầu khi tín hiệu mua xuất hiện và EMA nhanh cao hơn EMA chậm.
- Khi có tín hiệu bán và EMA nhanh thấp hơn EMA chậm, hãy tạo vị trí đầu trống.
Lợi thế chiến lược
- Kết hợp với chỉ số hồi phục tuyến tính và biến động, có thể xác định chính xác hơn tình trạng và xu hướng của thị trường.
- Sử dụng các chỉ số EMA bổ sung để xác nhận tín hiệu giao dịch, tăng độ tin cậy của chiến lược.
- Cho phép tối ưu hóa các tham số quan trọng để thích ứng với các môi trường thị trường và đặc tính giống khác nhau.
- Đồng thời, tính đến xu hướng và biến động, bạn có thể đặt cược kịp thời khi xu hướng rõ ràng và kiểm soát rủi ro khi biến động tăng lên.
Rủi ro chiến lược
- Lựa chọn tham số không đúng có thể dẫn đến chiến lược không hoạt động tốt, cần được tối ưu hóa theo các giống cụ thể và đặc điểm thị trường.
- Chiến lược này có thể xảy ra trong một thị trường chấn động hoặc một điểm biến động xu hướng, có thể xảy ra giao dịch thường xuyên hoặc tín hiệu sai.
- Chiến lược này phụ thuộc vào dữ liệu lịch sử và có thể không phản ứng kịp thời với các sự kiện bất ngờ hoặc biến động bất thường của thị trường.
Hướng tối ưu hóa chiến lược
- Tiếp theo, chúng tôi sẽ giới thiệu các chỉ số kỹ thuật hoặc các yếu tố cơ bản khác để làm giàu cơ sở quyết định chiến lược và cải thiện độ chính xác của tín hiệu.
- Lựa chọn các tham số tối ưu hóa, chẳng hạn như độ dài trở lại, nhân tỷ lệ dao động, chu kỳ EMA, v.v., để phù hợp với các giống và đặc điểm thị trường khác nhau.
- Tăng các cơ chế dừng lỗ và ngăn chặn, kiểm soát rủi ro giao dịch đơn lẻ và mức độ rút tiền tổng thể.
- Xem xét thêm các quy tắc quản lý vị trí và quản lý tài chính, điều chỉnh kích thước vị trí theo biến động thị trường và tài khoản.
Tóm tắt
Chiến lược này xác định trạng thái thị trường thông qua sự hồi phục tuyến tính và chỉ số biến động, và sử dụng EMA làm chỉ số xác nhận, xây dựng một chiến lược giao dịch thích ứng, logic rõ ràng. Ưu điểm của chiến lược là kết hợp xu hướng và biến động, đồng thời cho phép tối ưu hóa tham số, áp dụng cho các môi trường thị trường khác nhau.
Source
Pine
Strategy parameters
Related strategies
Comment
All comments (0)
No data
- 1