Chiến lược phân kỳ dao động xu hướng biến động,

1
Follow
1789
Followers
Tổng quan
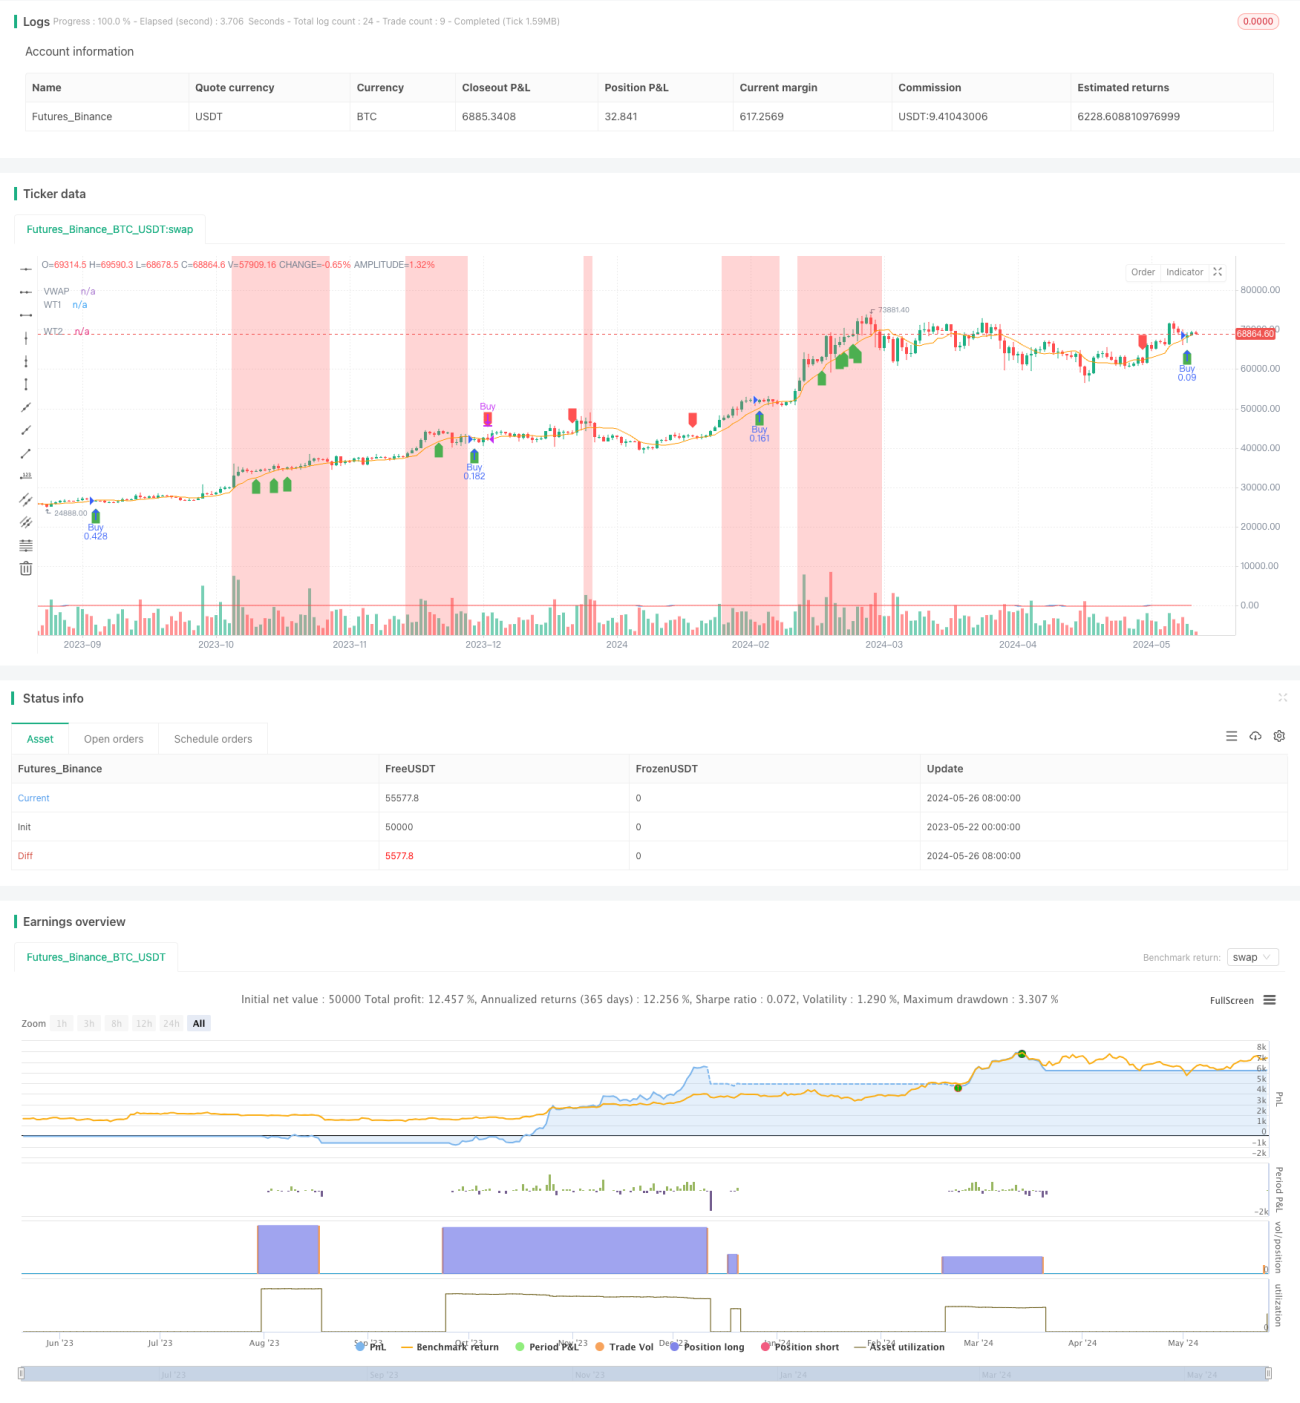
Chiến lược này kết hợp các chỉ số biến động WaveTrend (WT) và giá trung bình trọng lượng giao dịch (VWAP) để nắm bắt các cơ hội đảo ngược xu hướng tiềm năng bằng cách xác định giá và sự lệch của chỉ số. Chiến lược này sử dụng ATR (Phạm vi thực trung bình) để xác định vị trí dừng lỗ và điều chỉnh kích thước vị trí theo tỷ lệ rủi ro của tài khoản.
Nguyên tắc chiến lược
- Tính toán chỉ số dao động của WaveTrend ((WT): Tạo chỉ số dao động động động bằng cách so sánh giá hiện tại với sự khác biệt giữa kênh và giá trung bình của nó.
- Tính toán giá trung bình cân đối khối lượng giao dịch ((VWAP): Sử dụng khối lượng giao dịch làm trọng lượng để tính toán giá trung bình di chuyển.
- Xác định sự lệch giữa giá và chỉ số WT: Khi giá tạo ra một mức cao/thấp mới và chỉ số không tạo ra một mức cao/thấp mới, điều này cho thấy có thể có một sự đảo ngược xu hướng.
- Điều kiện nhập cảnh: Khi nhận ra đợt giảm giá, hãy mở thêm; Khi nhận ra đợt giảm giá, hãy giảm.
- Đặt điểm dừng động dựa trên ATR (Average True Range).
- Kích thước vị trí: Kích thước vị trí của mỗi giao dịch được điều chỉnh theo tỷ lệ rủi ro của tài khoản và khoảng cách dừng lỗ.
- Màu nền: Thay đổi màu nền tùy theo mức mua / bán quá mức của chỉ số, cung cấp thêm gợi ý trực quan.
Phân tích lợi thế
- Theo dõi xu hướng: Chiến lược này có thể nắm bắt cơ hội đảo ngược xu hướng tiềm ẩn bằng cách nhận diện giá cả và các chỉ số sai lệch.
- Quản lý rủi ro: Sử dụng dừng động dựa trên ATR và điều chỉnh quy mô vị trí theo tỷ lệ phần trăm rủi ro, giúp kiểm soát tổn thất tiềm ẩn.
- Dấu hiệu thị giác: Màu nền thay đổi tùy thuộc vào trạng thái quá mua / quá bán của chỉ số, cung cấp tín hiệu thị giác bổ sung cho nhà giao dịch.
- Tính linh hoạt: Các tham số của chiến lược (chẳng hạn như chiều dài kênh, chiều dài trung bình, cấp độ quá mua / quá bán) có thể được điều chỉnh theo các điều kiện thị trường và phong cách giao dịch khác nhau.
Phân tích rủi ro
- Thị trường biến động: Chiến lược này có thể chịu tổn thất liên tục trong điều kiện thị trường không có xu hướng rõ ràng.
- Tối ưu hóa tham số: Hiệu suất của chiến lược phụ thuộc rất nhiều vào sự lựa chọn tham số, thiết lập tham số không đúng cách có thể dẫn đến kết quả tối ưu hóa thứ cấp.
- Quá nhiều giao dịch: Các tín hiệu đi vào và ra ngoài thường xuyên có thể dẫn đến chi phí giao dịch cao hơn, ảnh hưởng đến hiệu suất tổng thể của chiến lược.
Hướng tối ưu hóa
- Trình lọc xu hướng: Khi xảy ra sự lệch, giới thiệu các chỉ số xác nhận xu hướng bổ sung (như trung bình di chuyển) để lọc các tín hiệu giả tiềm ẩn.
- Các tham số động: Các tham số chỉ số được điều chỉnh theo biến động của thị trường, sử dụng các kênh và độ dài trung bình ngắn hơn khi biến động thấp, sử dụng các tham số dài hơn khi biến động cao.
- Hạn chế: giới thiệu mức dừng động dựa trên tỷ lệ lợi nhuận rủi ro hoặc giá mục tiêu để quản lý tốt hơn các vị trí đã kiếm được lợi nhuận.
- Bộ lọc đa khoảng: Bộ lọc tín hiệu giao dịch theo hướng xu hướng tổng thể của thị trường (như đường trung bình di chuyển dài hạn) và chỉ giao dịch theo hướng xu hướng.
Tóm tắt
Chiến lược Phản xạ Phong trào Phong trào kết hợp các chỉ số xu hướng dao động và giá trung bình trọng lượng giao dịch để xác định cơ hội đảo ngược xu hướng tiềm ẩn. Ưu điểm của chiến lược là khả năng theo dõi xu hướng và các biện pháp quản lý rủi ro, nhưng có thể gặp rủi ro trong thị trường biến động.
Source
Pine
Strategy parameters
Related strategies
Comment
All comments (0)
No data
- 1