Chiến lược phát hiện xu hướng kênh G

Tổng quan
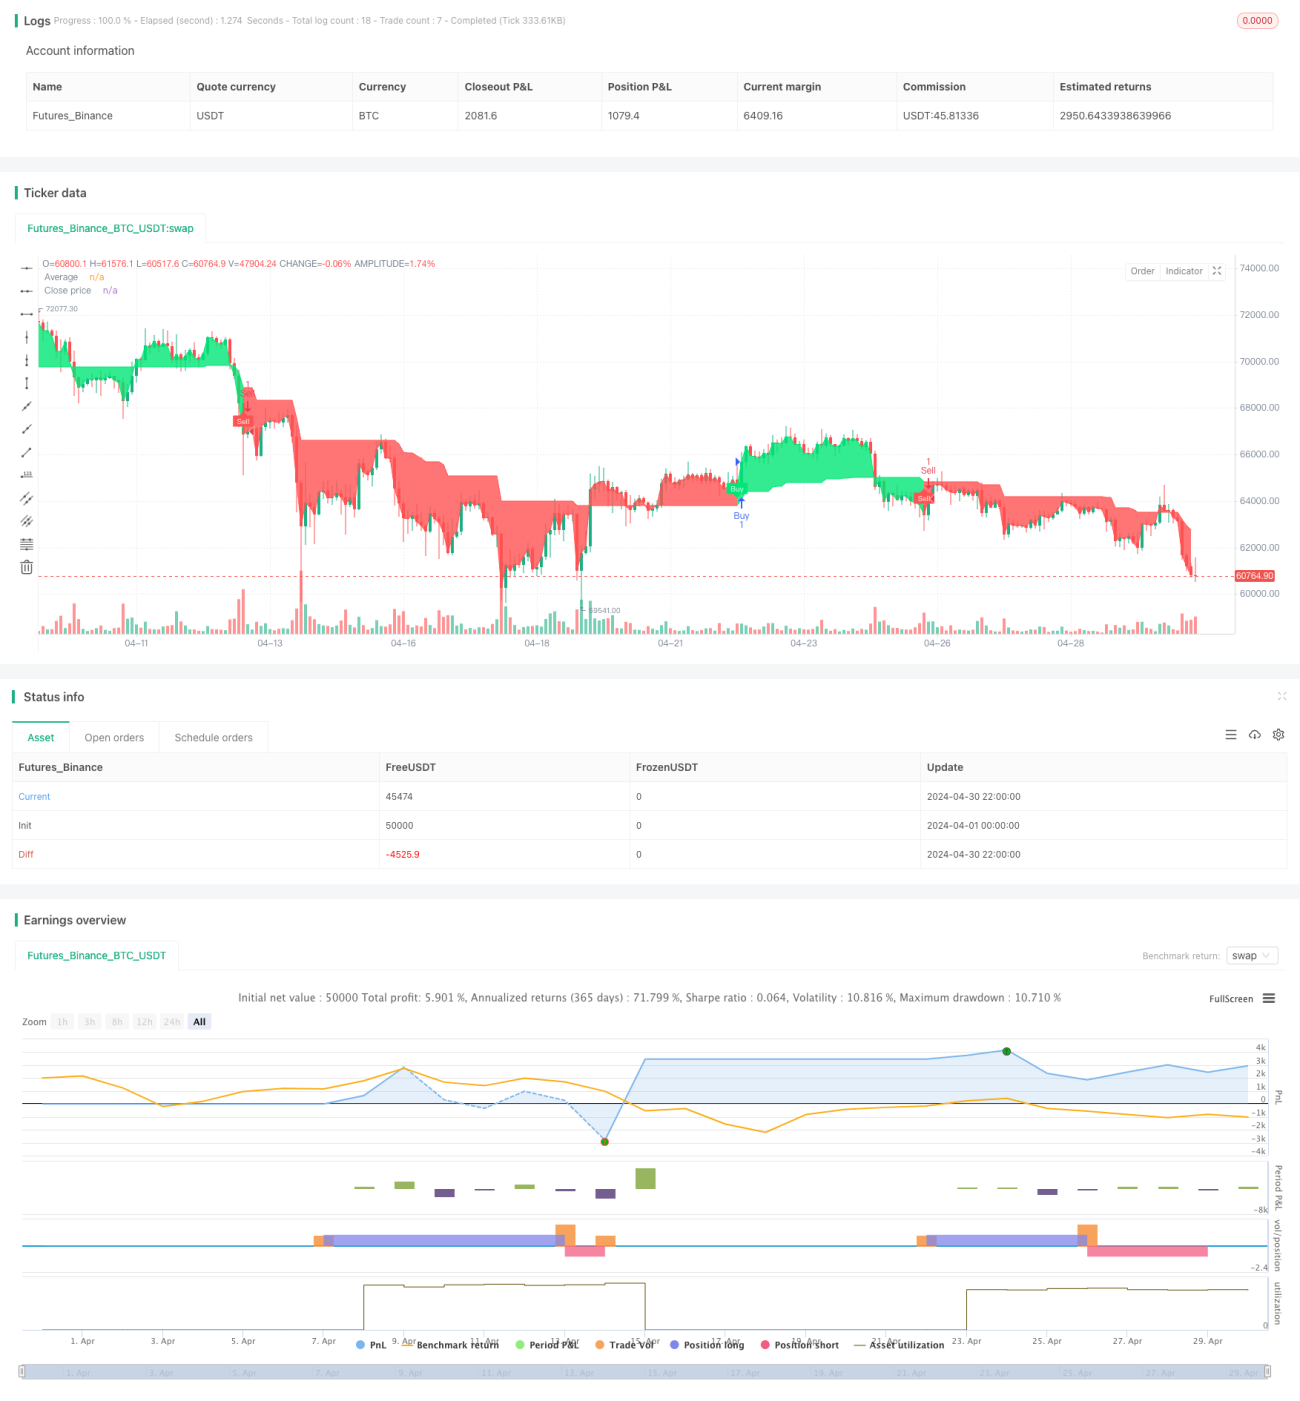
Chiến lược phát hiện xu hướng G-Channel là một chiến lược giao dịch định lượng dựa trên chỉ số kênh G. Chiến lược này tạo ra tín hiệu mua và bán bằng cách tính toán các cực đoan trên và dưới của kênh G và đánh giá xu hướng thị trường hiện tại dựa trên sự giao thoa của giá với đường trung bình kênh G. Đồng thời, chiến lược này cũng đặt các điều kiện dừng lỗ để kiểm soát rủi ro.
Nguyên tắc chiến lược
- Tính các cực trên và dưới của kênh G, trong đó a là chênh lệch giữa giá cao nhất lịch sử và giá trị của chu kỳ trước a chia cho số chu kỳ, b là giá thấp nhất lịch sử cộng với giá trị của chu kỳ trước a và b chia cho số chu kỳ.
- Tính trung bình đường trung bình của kênh G, tức là ((a + b) / 2 ◦
- Xác định tình huống giao thoa giữa giá và giá trị b, nếu giá vượt qua giá trị b, thì được coi là tạo ra xu hướng giảm giá; nếu giá vượt qua giá trị a, thì được coi là tạo ra xu hướng giảm giá.
- Trong một xu hướng giảm giá, nếu một đường K trước là giảm giá và đường K hiện tại chuyển sang giảm giá, sẽ tạo ra một tín hiệu mua; trong một xu hướng giảm giá, nếu một đường K trước là giảm giá và đường K hiện tại chuyển sang giảm giá, sẽ tạo ra một tín hiệu bán.
- Thiết lập điều kiện dừng lỗ khi giữ nhiều vị trí đầu, giá dừng là giá mua nhân số ((1 + tỷ lệ dừng), giá dừng là giá mua nhân số ((1-stop); khi giữ vị trí đầu trống, giá dừng là giá bán nhân số ((1-stop), giá dừng là giá bán nhân số ((1 + tỷ lệ dừng)).
Lợi thế chiến lược
- Chỉ số G-channel có khả năng nắm bắt xu hướng thị trường một cách hiệu quả, tạo ra tín hiệu mua và bán thông qua sự giao thoa của giá với đường trung bình G-channel, đơn giản và dễ sử dụng.
- Cài đặt Stop Loss có thể kiểm soát rủi ro một cách hiệu quả và ngăn chặn tổn thất quá lớn trong một giao dịch.
- Chiến lược logic rõ ràng, dễ hiểu và thực hiện, phù hợp cho người mới học giao dịch định lượng.
Rủi ro chiến lược
- Chỉ số G-channel có thể tạo ra nhiều tín hiệu sai lệch cho tình trạng biến động của thị trường, dẫn đến giao dịch thường xuyên và chi phí trượt cao.
- Cài đặt tỷ lệ dừng lỗ cần được điều chỉnh theo đặc điểm của thị trường và sở thích rủi ro cá nhân. Cài đặt tham số không phù hợp có thể dẫn đến lợi nhuận chiến lược kém.
- Chiến lược này không tính đến các đặc điểm của các loại giao dịch, chẳng hạn như các chiến lược cổ phiếu có thể bị ngừng hoạt động, dừng trượt, v.v., cần được tối ưu hóa thêm.
Hướng tối ưu hóa chiến lược
- Bạn có thể thử giới thiệu các chỉ số kỹ thuật khác, chẳng hạn như ATR, RSI, v.v. để xác nhận lại tín hiệu của chỉ số kênh G, tăng độ tin cậy của tín hiệu.
- Đối với tỷ lệ dừng lỗ, có thể sử dụng cách điều chỉnh động, điều chỉnh tự thích ứng theo các yếu tố như biến động của thị trường và thời gian giữ vị trí, nâng cao khả năng thích ứng của chiến lược.
- Đối với các đặc điểm của các loại giao dịch, có thể thêm các mô-đun kiểm soát gió tương ứng, chẳng hạn như đối với chiến lược cổ phiếu, có thể thiết lập logic xử lý trong trường hợp đặc biệt như dừng thẻ, dừng giảm giá.
Tóm tắt
Chiến lược phát hiện xu hướng G-Channel là một chiến lược giao dịch định lượng đơn giản dựa trên chỉ số G-Channel, tạo ra tín hiệu mua bán bằng cách nắm bắt xu hướng thị trường và thiết lập các điều kiện kiểm soát rủi ro dừng lỗ. Lập luận của chiến lược rõ ràng, dễ thực hiện, phù hợp với việc học giao dịch mới. Tuy nhiên, chiến lược này có thể tạo ra nhiều tín hiệu giả đối với thị trường rung động, tỷ lệ dừng lỗ cần được điều chỉnh theo đặc điểm của thị trường và không xem xét đặc điểm của loại giao dịch.
//@version=5
// Full credit to AlexGrover: https://www.tradingview.com/script/fIvlS64B-G-Channels-Efficient-Calculation-Of-Upper-Lower-Extremities/
strategy("G-Channel Trend Detection Strategy", shorttitle="G-Trend", overlay=true)

// Input parameters
length = input.int(100, title="Length")
src = input(close, title="Source")
take_profit_percent = input.float(5.0, title="Take Profit (%)")
stop_loss_percent = input.float(2.0, title="Stop Loss (%)")
showcross = input.bool(true, title="Show Cross")

// Initialize variables- 1