Chiến lược giao dịch Ichimoku Kumo
Ngày tạo:
2024-05-29 17:23:36
sửa đổi lần cuối:
2024-05-29 17:23:36
sao chép:
5
Số nhấp chuột:
742
1
tập trung vào
1750
Người theo dõi
Tổng quan
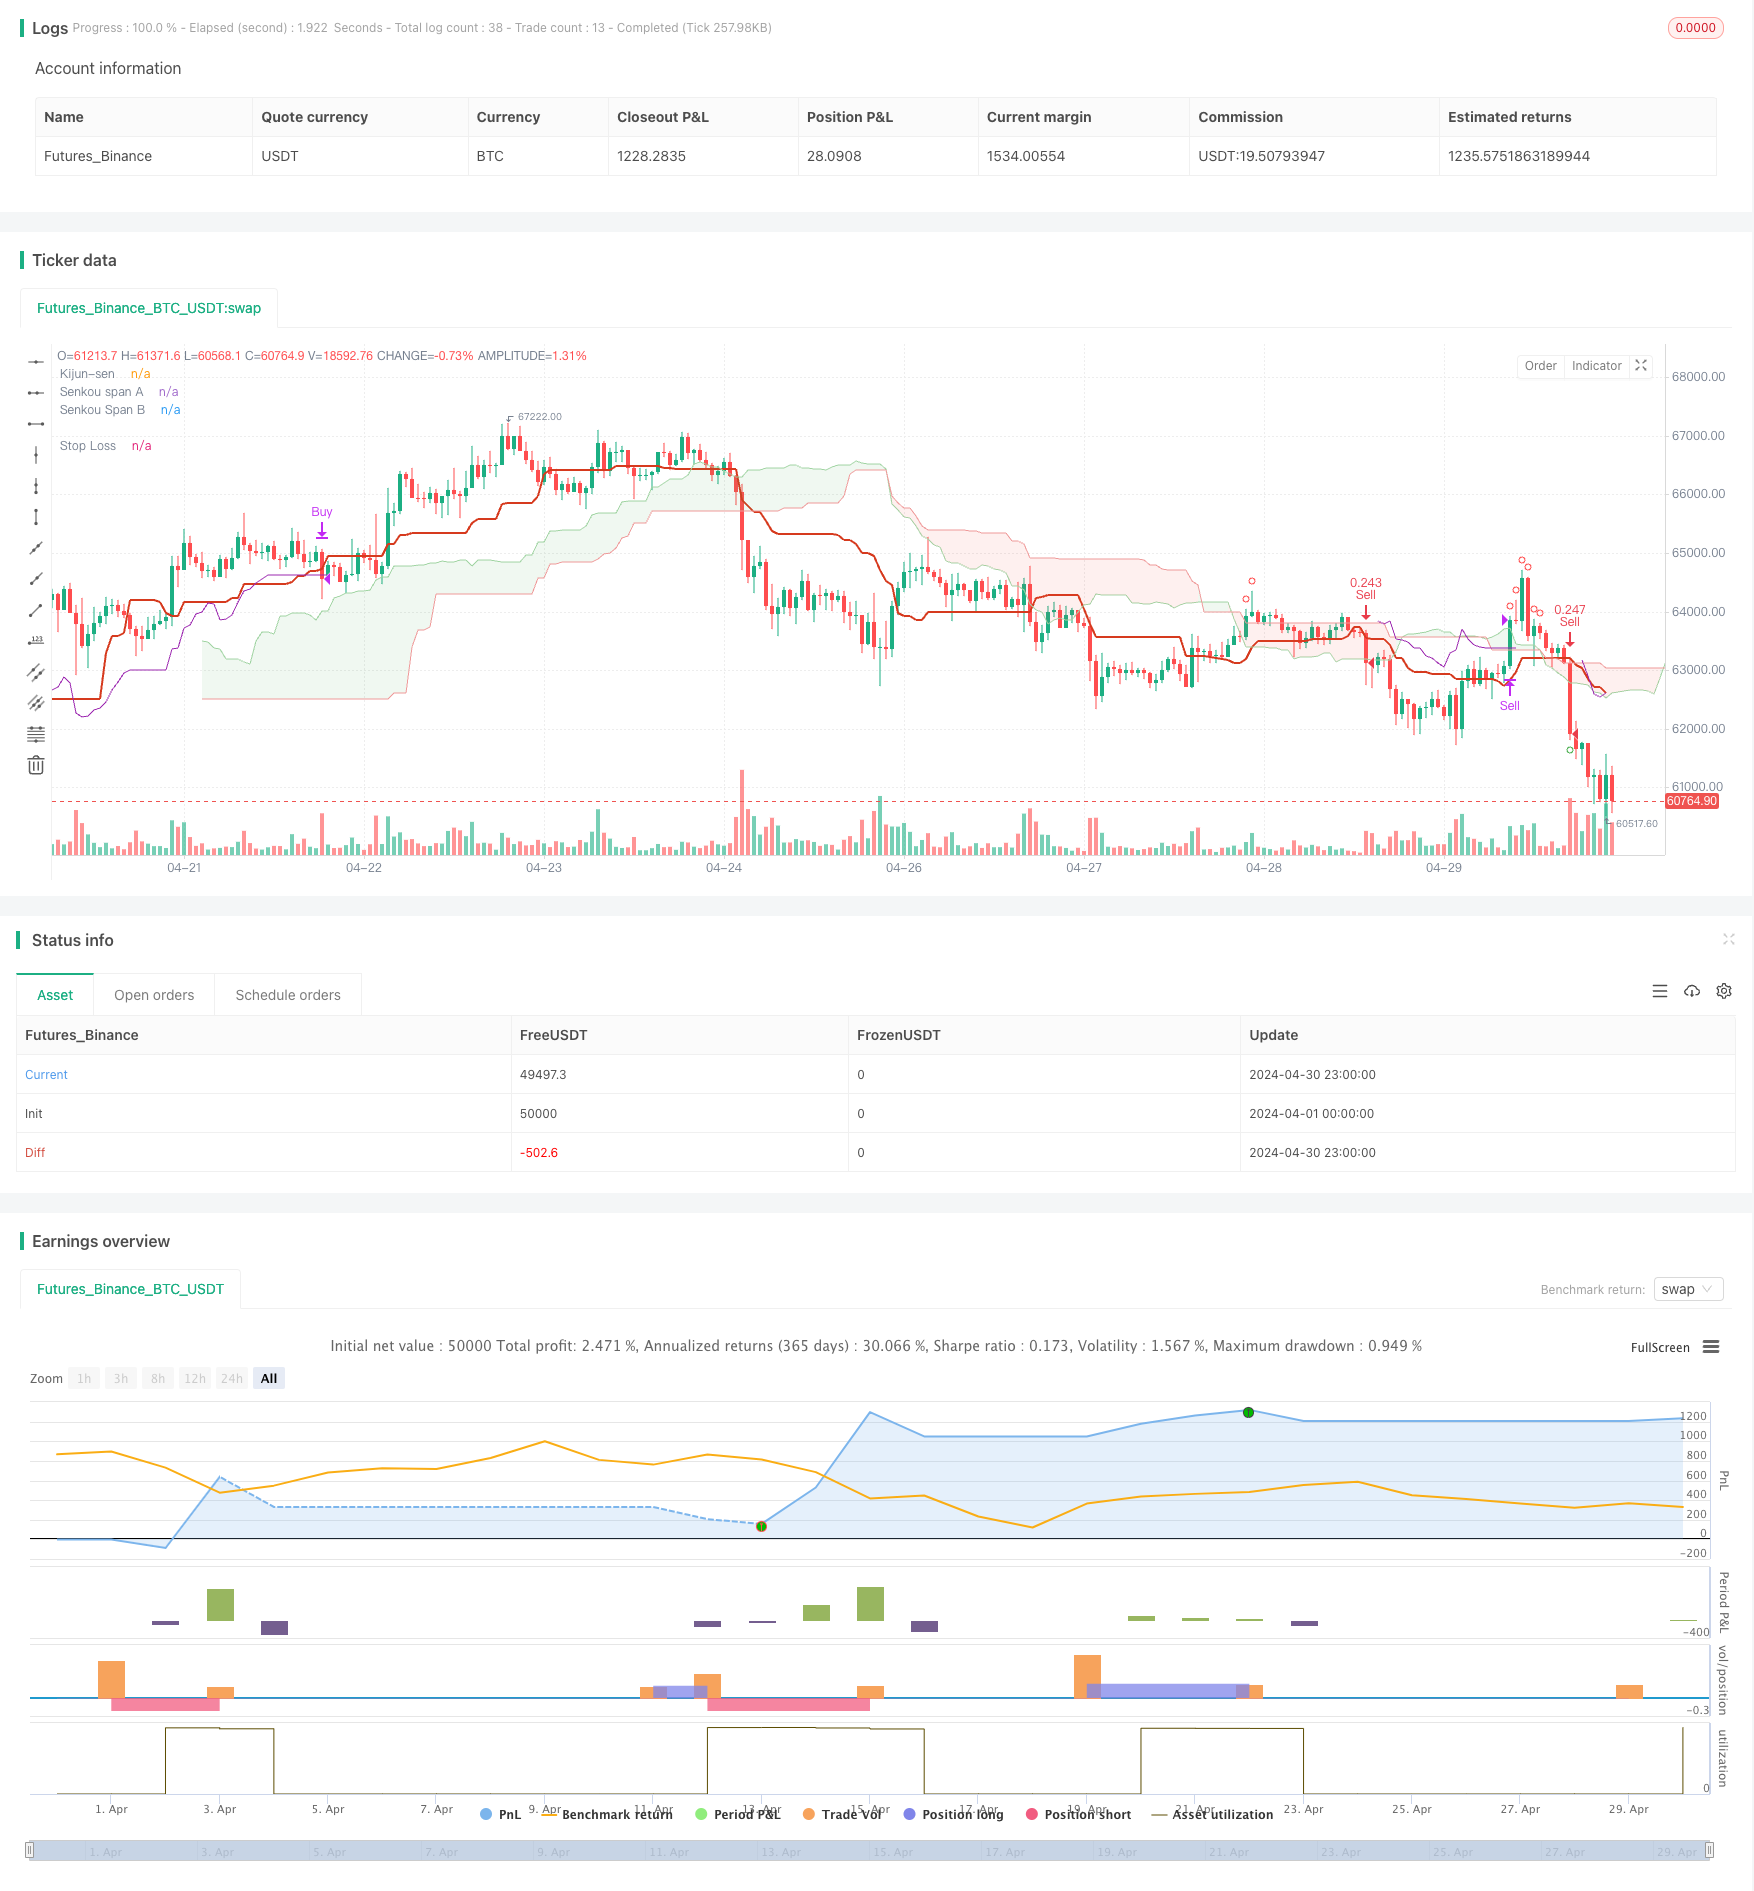
Chiến lược này sử dụng chỉ số Ichimoku Kumo để đánh giá xu hướng thị trường và tín hiệu giao dịch. Chiến lược này làm nhiều hơn dưới đám mây Kumo và làm giảm trên đám mây Kumo. Chiến lược sử dụng chỉ số ATR làm điểm dừng, đồng thời sử dụng đường Kijun-sen và đường Senkou Span để xác nhận tín hiệu vào. Chiến lược này cố gắng nắm bắt cơ hội giao dịch trong xu hướng mạnh, đồng thời kiểm soát rủi ro.
Nguyên tắc chiến lược
- Sử dụng các đường Kijun-sen, Tenkan-sen và Senkou Span trong chỉ số Ichimoku để đánh giá xu hướng thị trường.
- Khi giá đóng cửa ở dưới đường Senkou Span và đường Kijun-sen ở trên đám mây Kumo, tạo ra tín hiệu đa.
- Một tín hiệu giảm giá được tạo ra khi giá đóng cửa cao hơn đường Senkou Span và đường Kijun-sen dưới đám mây Kumo.
- Sử dụng chỉ số ATR để tính toán vị trí dừng lỗ, vị trí dừng lỗ là cao nhất / thấp nhất của 5 đường K gần nhất trừ / nhân 3 lần ATR
- Khi giá phá vỡ điểm dừng lỗ, vị thế thanh toán sẽ được rút ra.
Lợi thế chiến lược
- Chiến lược này dựa trên chỉ số Ichimoku, có khả năng phân tích toàn diện xu hướng thị trường.
- Chiến lược này cũng xem xét mối quan hệ của giá với đường Kijun-sen và đường Senkou Span để cải thiện độ tin cậy của tín hiệu vào cửa.
- Sử dụng ATR như là dừng, có thể động điều chỉnh vị trí dừng để kiểm soát rủi ro tốt hơn.
- Các vị trí dừng lỗ được thiết lập để tính đến sự biến động của thị trường và có thể thích ứng với các điều kiện thị trường khác nhau.
Rủi ro chiến lược
- Chiến lược này có thể tạo ra nhiều tín hiệu giả trong thị trường bất ổn, dẫn đến giao dịch thường xuyên và mất tiền.
- Hiệu suất của chiến lược phụ thuộc vào sự lựa chọn các tham số chỉ số Ichimoku, các tham số khác nhau có thể tạo ra kết quả giao dịch khác nhau.
- Trong một tình huống khắc nghiệt, giá có thể nhanh chóng phá vỡ điểm dừng, dẫn đến điểm trượt và mất mát lớn.
Hướng tối ưu hóa chiến lược
- Tiếp tục đưa ra các chỉ số kỹ thuật hoặc phân tích giá trị khác để hỗ trợ xác định xu hướng và thời gian nhập cảnh, cải thiện độ chính xác của tín hiệu.
- Tối ưu hóa thiết lập vị trí dừng lỗ, ví dụ như xem xét sử dụng dừng theo dõi hoặc dừng di động để bảo vệ an toàn tài khoản tốt hơn.
- Thêm quản lý vị trí vào chiến lược, điều chỉnh kích thước vị trí của mỗi giao dịch theo biến động thị trường và rủi ro tài khoản.
- Tối ưu hóa các tham số cho chiến lược, tìm ra các tham số phù hợp nhất với tình trạng thị trường hiện tại.
Tóm tắt
Chiến lược này sử dụng nhiều thành phần của chỉ số Ichimoku để thực hiện phân tích toàn diện về xu hướng thị trường. Đồng thời, chiến lược sử dụng ATR để kiểm soát rủi ro, tăng cường sự ổn định của chiến lược. Tuy nhiên, chiến lược có thể hoạt động kém trong thị trường xung đột và phụ thuộc vào lựa chọn tham số.
Mã nguồn chiến lược
/*backtest
start: 2024-04-01 00:00:00
end: 2024-04-30 23:59:59
period: 1h
basePeriod: 15m
exchanges: [{"eid":"Futures_Binance","currency":"BTC_USDT"}]
*/

// This Pine Script™ code is subject to the terms of the Mozilla Public License 2.0 at https://mozilla.org/MPL/2.0/
// © muratatilay

//@version=5
strategy(
     "Kumo Trade Concept",
     overlay=true,
     initial_capital=10000,
     currency=currency.USDT,
     default_qty_type=strategy.percent_of_equity,
     default_qty_value=30,
     commission_type=strategy.commission.percent,
     commission_value=0.1,
     margin_long=10,
     margin_short=10)


// ICHIMOKU Lines
//  INPUTS
tenkanSenPeriods = input.int(9, minval=1, title="Tenkan-sen")
kijunSenPeriods = input.int(26, minval=1, title="Kijun-sen")
senkouBPeriod = input.int(52, minval=1, title="Senkou span B")
displacement = input.int(26, minval=1, title="Chikou span")

donchian(len) => math.avg(ta.lowest(len), ta.highest(len))
tenkanSen = donchian(tenkanSenPeriods)
kijunSen = donchian(kijunSenPeriods)
senkouA = math.avg(tenkanSen, kijunSen)
senkouB = donchian(senkouBPeriod)

// Other Indicators
float   atrValue    = ta.atr(5)

// Calculate Senkou Span A 25 bars back
senkouA_current = math.avg(tenkanSen[25], kijunSen[25])
// Calculate Senkou Span B 25 bars back
senkouB_current = math.avg(ta.highest(senkouBPeriod)[25], ta.lowest(senkouBPeriod)[25])

// Kumo top bottom
senkou_max = (senkouA_current >= senkouB_current) ? senkouA_current : senkouB_current
senkou_min = (senkouB_current >= senkouA_current) ? senkouA_current : senkouB_current

// Trade Setups
long_setup = (kijunSen > senkou_max) and (close < senkou_min)
short_setup = (kijunSen < senkou_min ) and ( close > senkou_max )

// Check long_setup for the last 10 bars
long_setup_last_10 = false
for i = 0 to 50
    if long_setup[i]
        long_setup_last_10 := true
short_setup_last_10 = false
for i = 0 to 50
    if short_setup[i]
        short_setup_last_10 := true


closeSenkouCross = (close > senkou_max) and barstate.isconfirmed
closeKijunCross = (close > kijunSen )

senkouCloseCross = close < senkou_min
kijunCloseCross = close < kijunSen


// Handle Trades
// Enter Trade
var float trailStopLong = na
var float trailStopShort = na
if ( closeSenkouCross and long_setup_last_10 and closeKijunCross )
    strategy.entry(id="Buy", direction = strategy.long)
    trailStopLong := na
if senkouCloseCross and short_setup_last_10 and kijunCloseCross
    strategy.entry(id="Sell", direction = strategy.short)
    trailStopShort := na


// Update trailing stop
float temp_trailStop_long = ta.highest(high, 5) - (atrValue * 3)
float temp_trailStop_short = ta.lowest(low, 5) + (atrValue * 3)
if strategy.position_size > 0
    if temp_trailStop_long > trailStopLong or na(trailStopLong)
        trailStopLong := temp_trailStop_long
if strategy.position_size < 0
    if temp_trailStop_short < trailStopShort or na(trailStopShort)
        trailStopShort := temp_trailStop_short

// Handle strategy exit
if close < trailStopLong and barstate.isconfirmed
    strategy.close("Buy", comment="Stop Long")
if close > trailStopShort and barstate.isconfirmed
    strategy.close("Sell", comment="Stop Short")


// PRINT ON CHART
plot(kijunSen, color=color.rgb(214, 58, 30), title="Kijun-sen", linewidth=2)
p1 = plot(senkouA, offset=displacement - 1, color=#A5D6A7, title="Senkou span A")
p2 = plot(senkouB, offset=displacement - 1, color=#EF9A9A, title="Senkou Span B")
fill(p1, p2, color=senkouA > senkouB ? color.rgb(67, 160, 71, 90) : color.rgb(244, 67, 54, 90))
// PRINT SETUPS
plotshape(long_setup , style=shape.circle, color=color.green, location=location.belowbar, size=size.small)
plotshape(short_setup, style=shape.circle, color=color.red, location=location.abovebar, size=size.small)

// Trail Stop
plot(strategy.position_size[1] > 0 ? trailStopLong : na, style=plot.style_linebr, color=color.purple, title="Stop Loss")
plot(strategy.position_size[1] < 0 ? trailStopShort : na, style=plot.style_linebr, color=color.purple, title="Stop Loss")