Chiến lược mua và bán VWAP và SuperTrend

Tổng quan
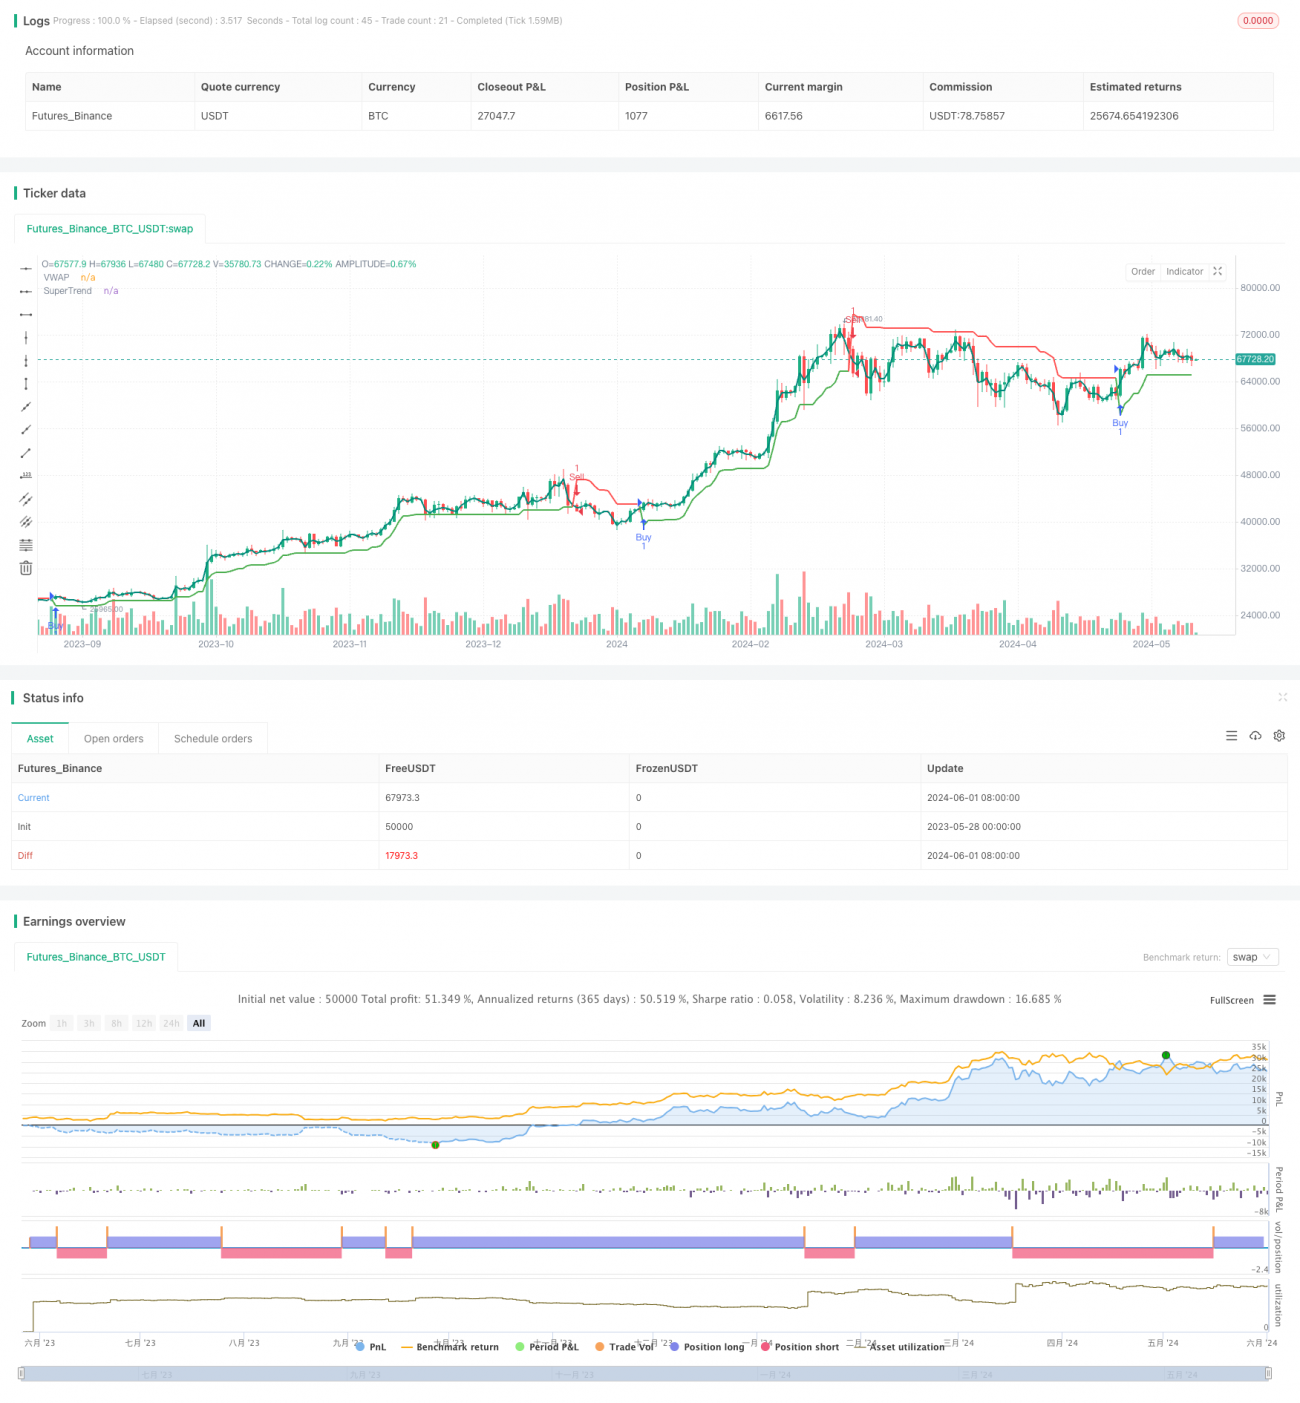
Chiến lược này kết hợp VWAP (giá trung bình có trọng lượng giao dịch) và chỉ số xu hướng siêu. Để đánh giá tín hiệu mua và bán bằng cách so sánh vị trí tương đối của giá với VWAP và hướng của chỉ số xu hướng siêu. Khi giá vượt qua VWAP và xu hướng siêu tích cực, tạo ra tín hiệu mua; Khi giá vượt qua VWAP và xu hướng siêu âm, tạo ra tín hiệu bán.
Nguyên tắc chiến lược
- Tính toán chỉ số VWAP, sử dụng hàm ta.vwap, có thể tùy chỉnh chiều dài của VWAP.
- Tính toán chỉ số siêu xu hướng, sử dụng hàm ta.supertrend, có thể tùy chỉnh chu kỳ và nhân ATR.
- Đánh giá điều kiện mua: VWAP trên giá hiện tại và hướng siêu xu hướng là tích cực.
- Xác định điều kiện bán: Giá hiện tại vượt qua VWAP và hướng siêu xu hướng là tiêu cực.
- Ghi lại trạng thái của tín hiệu trước, tránh các tín hiệu đồng hướng liên tiếp. Chỉ khi tín hiệu hiện tại khác với tín hiệu trước, tín hiệu giao dịch mới sẽ được tạo ra.
Lợi thế chiến lược
- Kết hợp hai chỉ số VWAP và siêu xu hướng, nó cho phép đánh giá toàn diện hơn về xu hướng thị trường và các điểm biến đổi tiềm năng.
- Chỉ số VWAP có tính đến các yếu tố giao dịch, giúp phản ánh tốt hơn sự phát triển thực tế của thị trường.
- Chỉ số siêu xu hướng có tính năng theo dõi xu hướng và lọc các biến động, giúp nắm bắt các xu hướng chính.
- Bằng cách tránh lặp lại các tín hiệu, bạn có thể giảm tần suất giao dịch và giảm chi phí giao dịch.
Rủi ro chiến lược
- Chiến lược này có thể tạo ra nhiều tín hiệu giả khi thị trường có nhiều biến động hoặc xu hướng không rõ ràng.
- Hiệu suất của chiến lược phụ thuộc vào sự lựa chọn của các tham số VWAP và siêu xu hướng, các thiết lập tham số khác nhau có thể dẫn đến kết quả khác nhau.
- Chiến lược này không tính đến quản lý rủi ro và kiểm soát vị trí, và khi thực hiện thực tế, cần kết hợp các biện pháp khác để kiểm soát rủi ro.
Hướng tối ưu hóa chiến lược
- Tham gia các cơ chế xác nhận xu hướng, chẳng hạn như sử dụng đường trung bình hoặc các chỉ số xu hướng khác để lọc thêm tín hiệu.
- Lựa chọn tham số tối ưu hóa, tìm ra độ dài VWAP, chu kỳ ATR và kết hợp nhân tối ưu bằng cách tra cứu dữ liệu lịch sử.
- Các biện pháp quản lý rủi ro như thiết lập các lệnh dừng lỗ và ngăn chặn để kiểm soát rủi ro giao dịch đơn lẻ.
- Xem xét thêm các chiến lược quản lý tiền, chẳng hạn như tỷ lệ cố định hoặc công thức Kelly, để tối ưu hóa kích thước vị trí.
Tóm tắt
Chiến lược mua và bán VWAP và siêu xu hướng tìm cách nắm bắt toàn diện xu hướng thị trường và các điểm chuyển đổi tiềm năng bằng cách kết hợp hai loại chỉ số khác nhau. Logic của chiến lược rõ ràng, dễ thực hiện và tối ưu hóa. Tuy nhiên, hiệu suất của chiến lược này phụ thuộc vào lựa chọn tham số và thiếu các biện pháp quản lý rủi ro. Trong ứng dụng thực tế, cần tối ưu hóa và hoàn thiện hơn nữa để phù hợp với môi trường thị trường và nhu cầu giao dịch khác nhau.
- 1