Theo dõi xu hướng SMA đa thời gian và chiến lược dừng lỗ động

Tổng quan
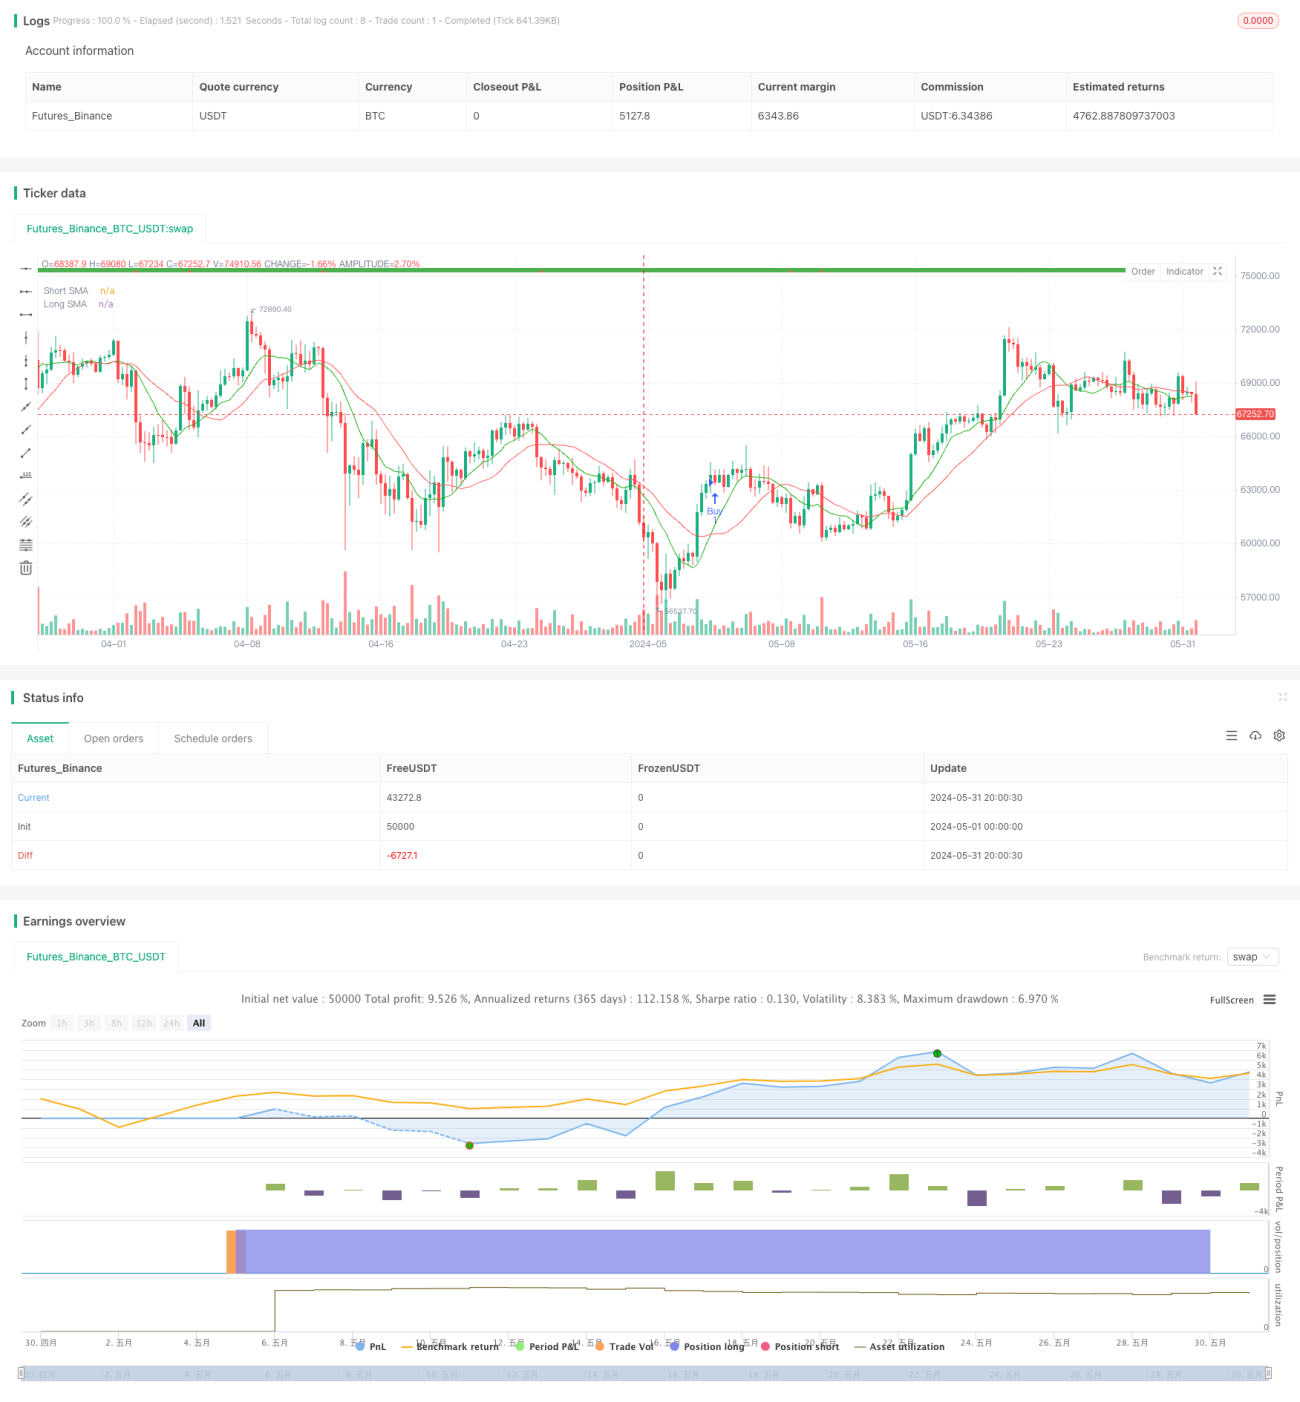
Chiến lược này dựa trên đường trung bình di chuyển đơn giản (SMA) trên các quy mô thời gian khác nhau để nắm bắt xu hướng thị trường. Bằng cách so sánh vị trí tương đối của SMA ngắn hạn và dài hạn, nó tạo ra tín hiệu mua và bán. Đồng thời, chiến lược này sử dụng các điều kiện xác nhận xu hướng để lọc các tín hiệu giả, cải thiện độ chính xác giao dịch. Ngoài ra, chiến lược này cũng có chức năng dừng và dừng lỗ để quản lý rủi ro.
Nguyên tắc chiến lược
- Tính toán SMA ngắn hạn và dài hạn để đánh giá xu hướng thị trường.
- Khi một SMA ngắn hạn trên một SMA dài hạn, nó tạo ra một tín hiệu mua; khi một SMA ngắn hạn dưới một SMA dài hạn, nó tạo ra một tín hiệu bán.
- Sử dụng các điều kiện xác nhận xu hướng để lọc các tín hiệu giả, chỉ thực hiện mua khi xu hướng chính là đa đầu và chỉ thực hiện bán khi xu hướng chính là không đầu.
- Cài đặt các chức năng dừng và dừng để kiểm soát rủi ro giao dịch. Khi giá đạt đến mức dừng hoặc dừng được đặt trước, bạn sẽ thoát khỏi vị trí.
- Điều chỉnh các vị thế theo xu hướng xác nhận điều kiện động. Khi xu hướng chính thay đổi, giảm vị thế kịp thời để ngăn chặn tổn thất do đảo ngược xu hướng.
Lợi thế chiến lược
- Theo dõi xu hướng: Chiến lược này dựa trên SMA trên các quy mô thời gian khác nhau, có thể nắm bắt hiệu quả các xu hướng chính của thị trường và thích ứng với các tình trạng thị trường khác nhau.
- Xác nhận xu hướng: Bằng cách đưa ra các điều kiện xác nhận xu hướng, lọc các tín hiệu giả, tăng độ tin cậy của tín hiệu giao dịch và giảm các giao dịch không hiệu lực.
- Quản lý rủi ro: Chức năng dừng và dừng lỗ được xây dựng để giúp kiểm soát rủi ro giao dịch và bảo vệ tài chính của nhà đầu tư.
- Điều chỉnh động lực: Điều chỉnh động lực giữ vị trí theo điều kiện xác nhận xu hướng, đáp ứng kịp thời với sự thay đổi của thị trường, giảm tổn thất do đảo ngược xu hướng.
Rủi ro chiến lược
- Rủi ro tối ưu hóa tham số: Hiệu suất của chiến lược phụ thuộc vào chu kỳ SMA, lựa chọn tham số cân bằng stop loss. Thiết lập tham số không phù hợp có thể dẫn đến hiệu quả chiến lược kém.
- Rủi ro của thị trường biến động: Trong môi trường thị trường biến động, các tín hiệu giao dịch thường xuyên có thể dẫn đến giao dịch quá mức, tăng chi phí giao dịch và rủi ro.
- Rủi ro sự kiện bất ngờ: Thị trường có thể biến động mạnh khi đối mặt với sự kiện lớn bất ngờ, và chiến lược này có thể không đáp ứng kịp thời, dẫn đến tổn thất lớn.
Hướng tối ưu hóa chiến lược
- Thêm nhiều chỉ số kỹ thuật: kết hợp với các chỉ số kỹ thuật khác, như MACD, RSI, để tăng độ chính xác và độ vững chắc của phán đoán xu hướng.
- Lựa chọn tham số tối ưu hóa: Tìm kiếm chu kỳ SMA tốt nhất, kết hợp các tham số cân bằng dừng lỗ, nâng cao hiệu suất chiến lược thông qua tra cứu dữ liệu lịch sử và tối ưu hóa tham số.
- Cải thiện quản lý rủi ro: giới thiệu các kỹ thuật quản lý rủi ro nâng cao hơn, chẳng hạn như dừng động, quản lý vị trí, v.v., để kiểm soát thêm lỗ hổng rủi ro.
- Thích ứng với các tình trạng thị trường khác nhau: tùy thuộc vào biến động của thị trường và cường độ của xu hướng, các tham số chiến lược được điều chỉnh động để chiến lược có thể thích ứng với các tình trạng thị trường khác nhau.
Tóm tắt
Chiến lược theo dõi xu hướng SMA đa thời gian và chiến lược dừng động sử dụng SMA để nắm bắt xu hướng thị trường trên các thang thời gian khác nhau, lọc các tín hiệu giả thông qua các điều kiện xác nhận xu hướng, đồng thời thiết lập các chức năng điều chỉnh giữ vị trí dừng lỗ và động, thực hiện mục tiêu theo dõi xu hướng và quản lý rủi ro. Mặc dù chiến lược này có một số ưu điểm, nhưng vẫn phải đối mặt với các rủi ro như tối ưu hóa tham số, thị trường rung động và sự kiện bất ngờ.
- 1