Chiến lược dừng lỗ động dựa trên đường trung bình động thích ứng lưới động K-line liên tục

Tổng quan
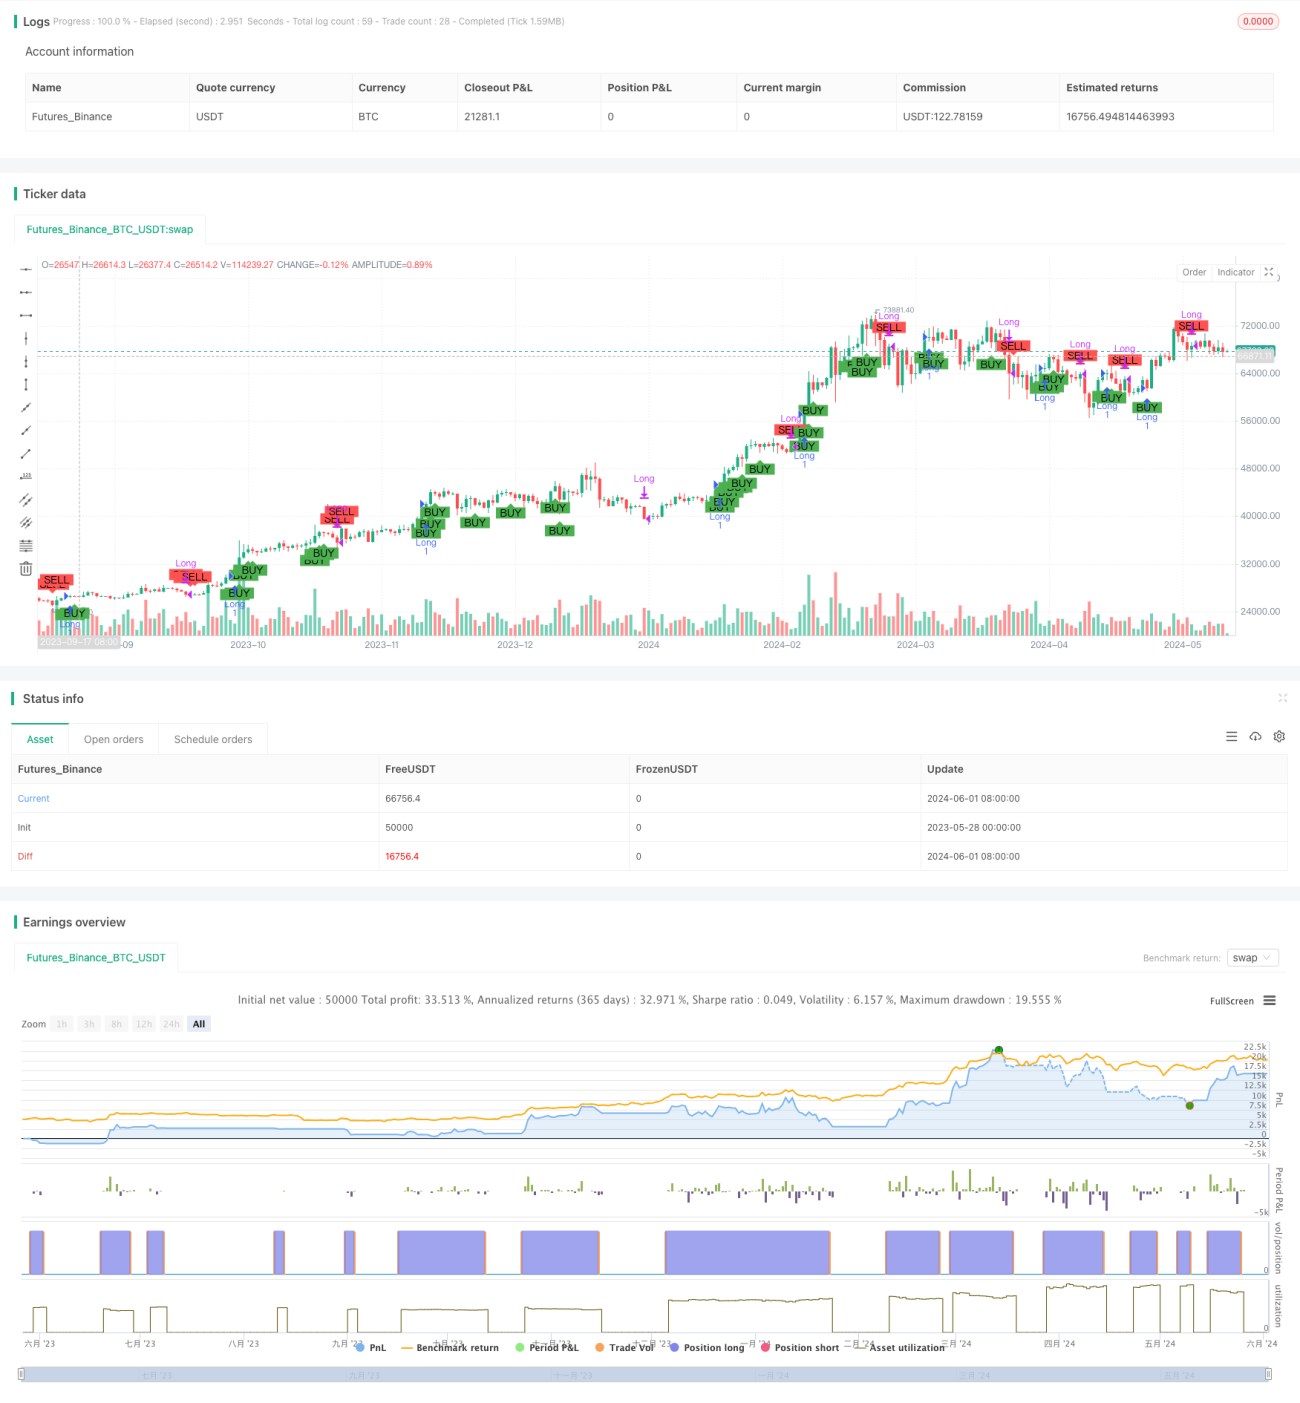
Chiến lược này dựa trên sự di chuyển của các đường K liên tiếp, để đánh giá xem có mở vị trí bằng cách so sánh giá đóng cửa hiện tại với giá đóng cửa của ba đường K trước đó. Khi ba đường K liên tiếp tăng cao, mở vị trí nhiều đầu, ngược lại là bán. Đồng thời, chiến lược này sử dụng phương pháp dừng động, xác định điểm dừng dựa trên giá mở vị trí và phần trăm dừng lỗ được thiết lập.
Nguyên tắc chiến lược
- Bằng cách so sánh giá đóng cửa hiện tại với giá đóng cửa của ba dòng K trước, đánh giá xem liệu nó có đáp ứng điều kiện ba dòng K liên tiếp tăng lên hoặc giảm xuống hay không.
- Nếu đáp ứng điều kiện ba đường K liên tiếp đi cao, hãy mở nhiều đầu khi mở đường K thứ tư.
- Sau khi mở vị trí, Stop Loss được tính dựa trên giá mở vị trí và phần trăm Stop Loss được thiết lập.
- Nếu đáp ứng điều kiện ba đường K liên tiếp đi xuống hoặc giá chạm mức dừng lỗ, vị trí sẽ bị xóa.
Lợi thế chiến lược
- Chiến lược này được đánh giá dựa trên sự di chuyển của các đường K liên tiếp, có thể nắm bắt cơ hội xu hướng của thị trường.
- Sử dụng phương pháp dừng động, điều chỉnh mức dừng theo giá mở và tỷ lệ phần trăm dừng trong thời gian thực, có thể kiểm soát tốt hơn rủi ro.
- Chiến lược này có logic rõ ràng, dễ hiểu và dễ thực hiện.
- Có thể áp dụng cho nhiều thị trường và giống, có tính phổ biến.
Rủi ro chiến lược
- Chiến lược này dựa trên phán đoán về xu hướng của đường K liên tục, nếu thị trường có biến động hoặc hành vi không theo xu hướng, có thể có tình huống mở lỗ thường xuyên, dẫn đến tăng chi phí giao dịch.
- Cài đặt vị trí dừng lỗ phụ thuộc vào lựa chọn phần trăm dừng lỗ, nếu lựa chọn không đúng, có thể dẫn đến dừng lỗ quá sớm hoặc quá muộn, ảnh hưởng đến hiệu suất của chiến lược.
- Chiến lược này không tính đến các đặc tính của các loại giao dịch, chẳng hạn như biến động, tính thanh khoản, v.v., cần được điều chỉnh theo từng trường hợp cụ thể trong ứng dụng thực tế.
Hướng tối ưu hóa chiến lược
- Tiếp tục giới thiệu các chỉ số kỹ thuật như trung bình di chuyển, MACD, và các chỉ số khác để giúp xác định chính xác các vị trí mở.
- Tối ưu hóa tham số cho tỷ lệ dừng lỗ, tìm các thiết lập dừng lỗ tốt nhất, nâng cao khả năng kiểm soát rủi ro của chiến lược.
- Xem xét thêm các logic quản lý vị trí, điều chỉnh vị trí động theo các yếu tố như biến động của thị trường, số tiền trên tài khoản, nâng cao hiệu quả sử dụng tiền.
- Các tham số chiến lược được tối ưu hóa cho các loại giao dịch và đặc điểm thị trường khác nhau để cải thiện khả năng thích ứng của chiến lược.
Tóm tắt
Chiến lược này được sử dụng để đưa ra quyết định mở lỗ bằng cách đánh giá xu hướng của các đường K liên tục, đồng thời sử dụng phương pháp dừng lỗ động để kiểm soát rủi ro. Lập luận của chiến lược rõ ràng, dễ hiểu và thực hiện, áp dụng cho nhiều thị trường và giống. Tuy nhiên, trong ứng dụng thực tế, cần chú ý đến rủi ro không theo xu hướng của thị trường và tối ưu hóa các tham số như tỷ lệ dừng lỗ. Ngoài ra, việc giới thiệu nhiều chỉ số kỹ thuật, quản lý vị trí và các phương pháp khác có thể tiếp tục nâng cao hiệu suất chiến lược.
- 1