Chiến lược mua và bán dựa trên tín hiệu giá khối lượng và mô hình nến

Tổng quan
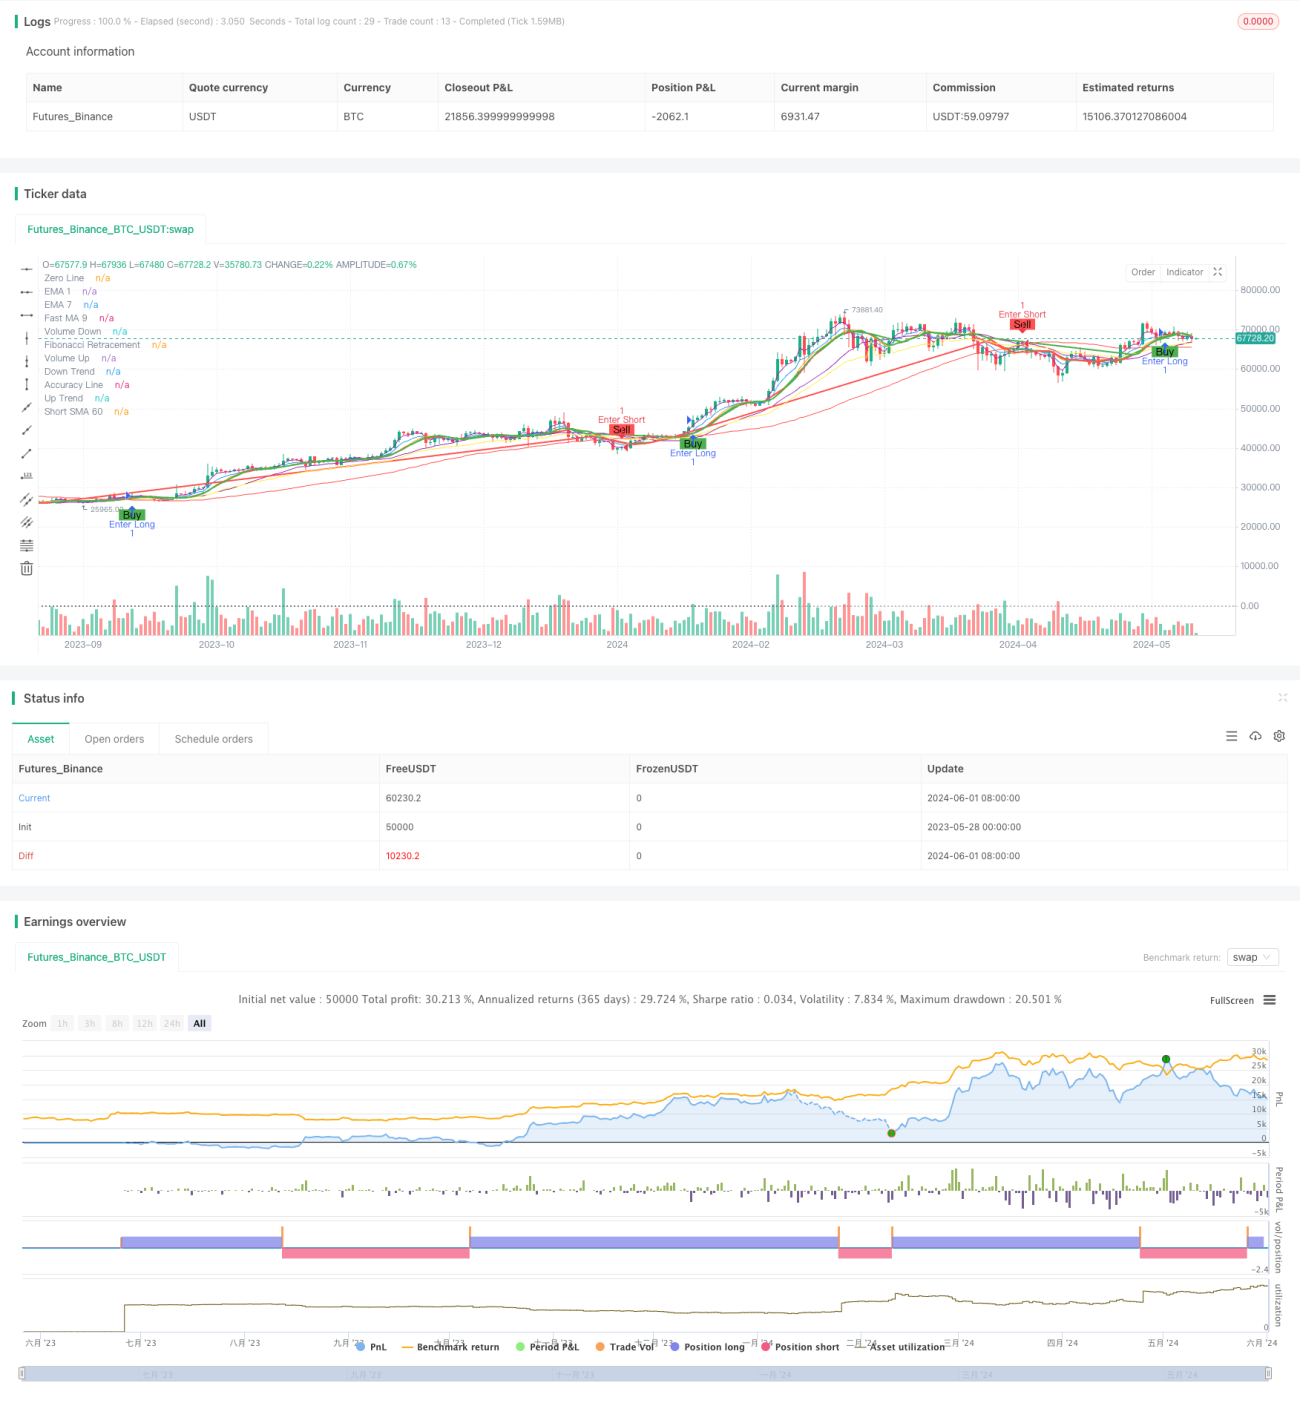
Chiến lược này kết hợp các tín hiệu giá và khối lượng giao dịch, cũng như mức thu hồi Fibonacci, tạo ra tín hiệu mua và bán trong khung thời gian 15 phút và 45 phút. Chiến lược sử dụng một số đường trung bình di chuyển (MA) làm chỉ số xu hướng và chuyển động, bao gồm đường trung bình di chuyển đơn giản (SMA) và đường trung bình di chuyển chỉ số (EMA). Ngoài ra, nó cũng sử dụng mức thu hồi Fibonacci như một điểm tham gia tiềm năng. Mục tiêu chính của chiến lược là nắm bắt cơ hội mua và bán khi có sự thay đổi đáng kể về giá và khối lượng giao dịch.
Nguyên tắc chiến lược
- Tính toán MA nhanh (bằng mặc định 10) và MA chậm (bằng mặc định 30), thể hiện xu hướng tăng khi MA nhanh cao hơn MA chậm và ngược lại thể hiện xu hướng giảm.
- Tính toán khối lượng giao dịch MA ((được mặc định là 20), khối lượng giao dịch hiện tại cao hơn khối lượng giao dịch MA cho thấy khối lượng giao dịch tăng, ngược lại cho thấy khối lượng giao dịch giảm.
- Sử dụng nhiều MA và EMA như các chỉ số phụ trợ, bao gồm MA nhanh (bằng mặc định 9), SMA ngắn hạn (bằng mặc định 10 và 60), và EMA (bằng mặc định 3 và 7).
- Tính các mức thu hồi Fibonacci ((0.47, 0.658 và 0.886)) như các mức hỗ trợ và kháng cự tiềm năng.
- Một tín hiệu mua hoặc bán được tạo ra khi đường SMA ngắn hạn (SMA 60) giao nhau với đường chính xác (SMA 60 dựa trên sự giao nhau của EMA nhanh và EMA chậm).
- Khi tốc độ MA ((9)) và EMA ((7) giao nhau, nó tạo ra tín hiệu đồng bằng.
Phân tích lợi thế
- Nó kết hợp thông tin về giá cả và khối lượng giao dịch để cung cấp một phân tích thị trường toàn diện hơn.
- Sử dụng nhiều MA và EMA như các chỉ số hỗ trợ, giúp xác nhận xu hướng và thay đổi động lực.
- Mức độ rút Fibonacci cung cấp một tham chiếu cho các điểm tham gia tiềm năng, giúp tối ưu hóa thời gian tham gia.
- Các tín hiệu mua và bán dựa trên sự giao thoa giữa đường SMA ngắn hạn và đường chính xác, giúp nắm bắt các điểm biến động của thị trường kịp thời.
- Các tín hiệu ngang dựa trên sự giao thoa của MA và EMA nhanh chóng, giúp khóa lợi nhuận hoặc dừng lỗ kịp thời.
Phân tích rủi ro
- Trong một thị trường bất ổn, các tín hiệu giao thoa thường xuyên có thể dẫn đến quá nhiều giao dịch và mất phí xử lý.
- Chiến lược này phụ thuộc vào các mức MA và Fibonacci được tính toán dựa trên dữ liệu lịch sử và có thể không thích ứng kịp thời với sự thay đổi đột ngột của thị trường.
- Chiến lược thiếu đánh giá về sức mạnh của xu hướng thị trường, có thể tạo ra tín hiệu sai khi xu hướng yếu hơn.
- Các tham số của chiến lược (ví dụ như chu kỳ MA) cần được tối ưu hóa cho các điều kiện thị trường khác nhau, nếu không có thể ảnh hưởng đến hiệu quả của chiến lược.
Hướng tối ưu hóa
- Tiếp theo, các nhà đầu tư có thể sử dụng các chỉ số cường độ của xu hướng (như ADX), tránh giao dịch khi xu hướng yếu hoặc sử dụng các chiến lược bảo thủ hơn.
- Tối ưu hóa các tham số chu kỳ của MA và EMA để phù hợp với các điều kiện thị trường khác nhau và các loại giao dịch.
- Kết hợp với các chỉ số kỹ thuật khác (như RSI, MACD) để tăng độ tin cậy của tín hiệu.
- Các cơ chế dừng lỗ và ngăn chặn được giới thiệu để kiểm soát lỗ hổng rủi ro của giao dịch đơn lẻ.
- Đối với thị trường chấn động, hãy xem xét sử dụng chiến lược giao dịch phù hợp hơn (ví dụ như giao dịch phạm vi).
Tóm tắt
Chiến lược này tạo ra tín hiệu mua và bán bằng cách kết hợp giá, khối lượng giao dịch và mức thu hồi Fibonacci trong nhiều khung thời gian. Ưu điểm của chiến lược là xem xét tổng hợp nhiều yếu tố thị trường và sử dụng nhiều MA và EMA làm chỉ số phụ trợ. Tuy nhiên, chiến lược có thể tạo ra quá nhiều tín hiệu giao dịch trong thị trường bất ổn và phụ thuộc vào các chỉ số được tính toán dựa trên dữ liệu lịch sử, do đó cần được tối ưu hóa hơn nữa để cải thiện tính phù hợp và độ tin cậy của nó.
- 1