Chiến lược đường trung bình động dựa trên sự giao thoa của đường trung bình động kép

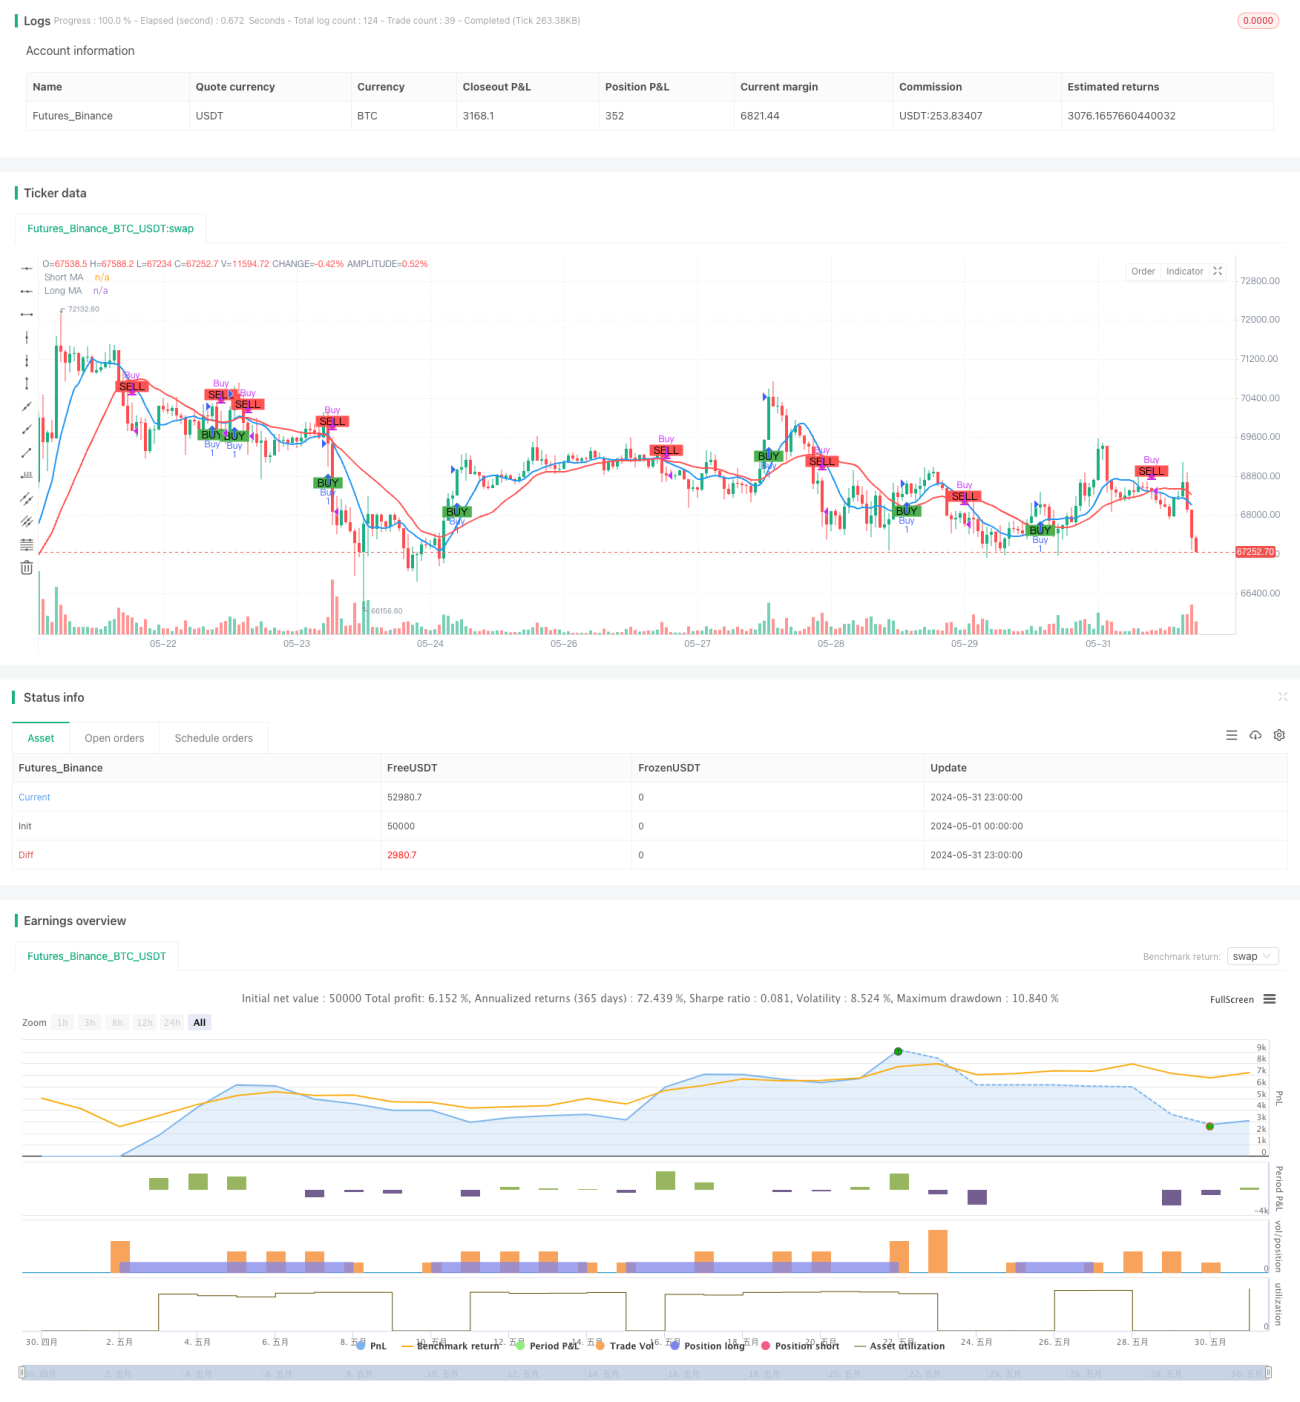
Tổng quan
Chiến lược đường trung bình di chuyển dựa trên đường trung bình đôi là một phương pháp giao dịch đơn giản và hiệu quả trong ngày nhằm xác định cơ hội mua và bán tiềm năng của thị trường bằng cách phân tích mối quan hệ giữa hai đường trung bình di chuyển trong hai chu kỳ khác nhau. Chiến lược này sử dụng một đường trung bình di chuyển ngắn hạn (SMA) và đường trung bình di chuyển ngắn hạn (SMA) khi đường trung bình ngắn hạn vượt qua đường trung bình dài hạn, cho thấy tín hiệu tăng giá, gợi ý cơ hội mua tiềm năng; ngược lại, khi đường trung bình ngắn hạn vượt qua đường trung bình dài hạn, cho thấy tín hiệu giảm giá, gợi ý cơ hội bán tiềm năng.
Nguyên tắc chiến lược
Nguyên tắc cốt lõi của chiến lược này là sử dụng các đặc tính và độ trễ của xu hướng của các đường trung bình di chuyển khác nhau, bằng cách so sánh đường trung bình ngắn hạn và mối quan hệ vị trí tương đối của đường trung bình dài hạn, để đánh giá xu hướng của thị trường hiện tại và đưa ra quyết định giao dịch phù hợp. Khi thị trường có xu hướng tăng, giá sẽ vượt qua đường trung bình dài hạn, sau đó xuyên qua đường trung bình dài hạn để tạo ra tín hiệu mua; khi thị trường có xu hướng giảm, giá sẽ rơi xuống đường trung bình dài hạn, đường trung bình ngắn hạn, sau đó xuyên qua đường trung bình dài hạn để tạo ra dấu hiệu bán. Trong các tham số của chiến lược, đường trung bình ngắn hạn có chu kỳ 9 và đường trung bình dài hạn là 21, hai tham số có thể được điều chỉnh theo đặc điểm và sở thích cá nhân của thị trường.
Lợi thế chiến lược
- Đơn giản và dễ hiểu: Chiến lược này dựa trên lý thuyết trung bình di chuyển cổ điển, logic rõ ràng, dễ hiểu và thực hiện.
- Khả năng thích ứng: Chiến lược này có thể áp dụng cho nhiều thị trường và các loại giao dịch khác nhau, có thể đáp ứng các đặc điểm thị trường khác nhau một cách linh hoạt bằng cách điều chỉnh các thiết lập tham số.
- Bắt xu hướng: Xác định hướng xu hướng bằng cách giao nhau bằng hai đường ngang, giúp các nhà giao dịch kịp thời theo dõi xu hướng chính để tăng cơ hội kiếm lợi nhuận.
- Kiểm soát rủi ro: Chiến lược này giới thiệu khái niệm quản lý rủi ro, kiểm soát lỗ hổng rủi ro của mỗi giao dịch bằng cách điều chỉnh vị trí và quản lý hiệu quả các tổn thất tiềm ẩn.
- Giảm tiếng ồn: Sử dụng tính chất chậm trễ của đường trung bình, lọc hiệu quả tiếng ồn ngẫu nhiên trong thị trường, tăng độ tin cậy của tín hiệu giao dịch.
Rủi ro chiến lược
- Lựa chọn tham số: Các thiết lập tham số khác nhau có thể ảnh hưởng đến hiệu suất của chiến lược. Việc lựa chọn không đúng có thể dẫn đến thất bại hoặc hiệu suất kém của chiến lược.
- Xu hướng thị trường: Chiến lược này có thể xảy ra thua lỗ liên tục trong thị trường bất ổn hoặc tại các điểm thay đổi xu hướng.
- Chi phí trượt: giao dịch thường xuyên có thể tạo ra chi phí trượt cao hơn, ảnh hưởng đến lợi nhuận tổng thể của chiến lược.
- Sự kiện Thiên nga đen: Chiến lược này không thích ứng tốt với các tình huống cực đoan, và sự kiện Thiên nga đen có thể gây thiệt hại lớn cho chiến lược.
- Rủi ro quá phù hợp: Nếu các tham số được tối ưu hóa quá phụ thuộc vào dữ liệu lịch sử, nó có thể dẫn đến chiến lược không hoạt động tốt trong giao dịch thực tế.
Hướng tối ưu hóa chiến lược
- Tối ưu hóa các tham số động: Điều chỉnh các tham số chiến lược động theo tình trạng thị trường thay đổi, nâng cao khả năng thích ứng.
- Xác nhận xu hướng: Sau khi tạo ra tín hiệu giao dịch, giới thiệu các chỉ số khác hoặc mô hình hành vi giá để xác nhận xu hướng, nâng cao độ tin cậy của tín hiệu.
- Chặn lỗ: đưa ra các cơ chế chặn lỗ hợp lý để kiểm soát thêm các lỗ hổng rủi ro của giao dịch đơn lẻ.
- Quản lý vị trí: Phương pháp tối ưu hóa điều chỉnh vị trí, chẳng hạn như giới thiệu chỉ số tỷ lệ dao động, điều chỉnh vị trí theo mức độ biến động của thị trường.
- Đánh giá sức mạnh đa chiều: đánh giá mối quan hệ tương đối giữa sức mạnh đa chiều và sức mạnh không chiều, can thiệp vào xu hướng sớm, cải thiện độ chính xác của việc nắm bắt xu hướng.
Tóm tắt
Chiến lược đường trung bình di chuyển dựa trên đường trung bình hai chiều là một phương pháp giao dịch trong ngày đơn giản và thực tế, đánh giá xu hướng thị trường bằng cách so sánh mối quan hệ vị trí của các đường trung bình chu kỳ khác nhau, tạo ra tín hiệu giao dịch. Chiến lược này có logic rõ ràng, thích ứng mạnh mẽ, có thể nắm bắt xu hướng thị trường một cách hiệu quả, đồng thời đưa ra các biện pháp quản lý rủi ro để kiểm soát tổn thất tiềm ẩn. Tuy nhiên, chiến lược này cũng có các tham số, lựa chọn xu hướng biến đổi, giao dịch thường xuyên và các rủi ro tiềm ẩn khác, cần nâng cao hơn nữa sự ổn định và khả năng sinh lợi của chiến lược bằng cách tối ưu hóa động, xác nhận tín hiệu, quản lý vị trí. Nói chung, đường trung bình di chuyển là một chỉ số phân tích kỹ thuật cổ điển, các nguyên tắc cơ bản và giá trị ứng dụng thực tế của nó đã được chứng minh rộng rãi trên thị trường và đáng để nghiên cứu sâu và tối ưu hóa liên tục.
Overview
The Moving Average Crossover Strategy based on dual moving averages is a straightforward and effective intraday trading approach designed to identify potential buy and sell opportunities in the market by analyzing the relationship between two moving averages of different periods. This strategy utilizes a short-term simple moving average (SMA) and a long-term simple moving average. When the short-term moving average crosses above the long-term moving average, it indicates a bullish signal, suggesting a potential buying opportunity. Conversely, when the short-term moving average crosses below the long-term moving average, it indicates a bearish signal, suggesting a potential selling opportunity. This crossover method helps traders capture trending moves in the market while minimizing market noise interference.
Strategy Principle
The core principle of this strategy is to utilize the trend characteristics and lag of moving averages with different periods. By comparing the relative position relationship between the short-term moving average and the long-term moving average, it determines the current market trend direction and makes corresponding trading decisions. When an upward trend emerges in the market, the price will first break through the long-term moving average, and the short-term moving average will subsequently cross above the long-term moving average, forming a golden cross and generating a buy signal. When a downward trend emerges in the market, the price will first break below the long-term moving average, and the short-term moving average will subsequently cross below the long-term moving average, forming a death cross and generating a sell signal. In the parameter settings of this strategy, the period of the short-term moving average is set to 9, and the period of the long-term moving average is set to 21. These two parameters can be adjusted based on market characteristics and personal preferences. Additionally, this strategy introduces the concept of money management by setting the initial capital and risk percentage per trade, using position sizing to control the risk exposure of each trade.
Strategy Advantages
- Simplicity: This strategy is based on the classic moving average theory, with clear logic and easy to understand and implement.
- Adaptability: This strategy can be applied to multiple markets and different trading instruments. By adjusting parameter settings, it can flexibly adapt to different market characteristics.
- Trend Capture: By using the dual moving average crossover to determine the trend direction, it helps traders timely follow the mainstream trend and increase profit opportunities.
- Risk Control: This strategy introduces the concept of risk management, using position sizing to control the risk exposure of each trade, effectively managing potential losses.
- Noise Reduction: By utilizing the lag characteristic of moving averages, it effectively filters out random noise in the market, improving the reliability of trading signals.
Strategy Risks
- Parameter Selection: Different parameter settings can have a significant impact on strategy performance. Improper selection may lead to strategy failure or poor performance.
- Market Trend: In ranging markets or trend turning points, this strategy may experience consecutive losses.
- Slippage Costs: Frequent trading may result in higher slippage costs, affecting the overall profitability of the strategy.
- Black Swan Events: This strategy has poor adaptability to extreme market conditions, and black swan events may cause significant losses to the strategy.
- Overfitting Risk: If parameter optimization relies too heavily on historical data, it may lead to poor performance of the strategy in actual trading.
Strategy Optimization Directions
- Dynamic Parameter Optimization: Dynamically adjust strategy parameters based on changes in market conditions to improve adaptability.
- Trend Confirmation: After generating trading signals, introduce other indicators or price behavior patterns to confirm the trend, improving signal reliability.
- Stop-Loss and Take-Profit: Introduce reasonable stop-loss and take-profit mechanisms to further control the risk exposure of each trade.
- Position Management: Optimize the position sizing method, such as introducing volatility indicators to dynamically adjust positions based on market volatility levels.
- Long-Short Strength Assessment: Assess the comparative relationship between bullish and bearish strengths, entering at the early stage of a trend to improve the accuracy of trend capture.
Summary
The Moving Average Crossover Strategy based on dual moving averages is a simple and practical intraday trading method. By comparing the position relationship of moving averages with different periods, it determines the market trend direction and generates trading signals. This strategy has clear logic, strong adaptability, and can effectively capture market trends while introducing risk management measures to control potential losses. However, this strategy also has potential risks such as parameter selection, trend reversal, frequent trading, etc. It needs to be further improved through dynamic optimization, signal confirmation, position management, and other methods to enhance the robustness and profitability of the strategy. In general, as a classic technical analysis indicator, the basic principles and practical application value of moving averages have been widely verified by the market. It is a trading strategy worthy of in-depth research and continuous optimization.
- 1