Chiến lược dừng lỗ thoái lui động RSI

Tổng quan
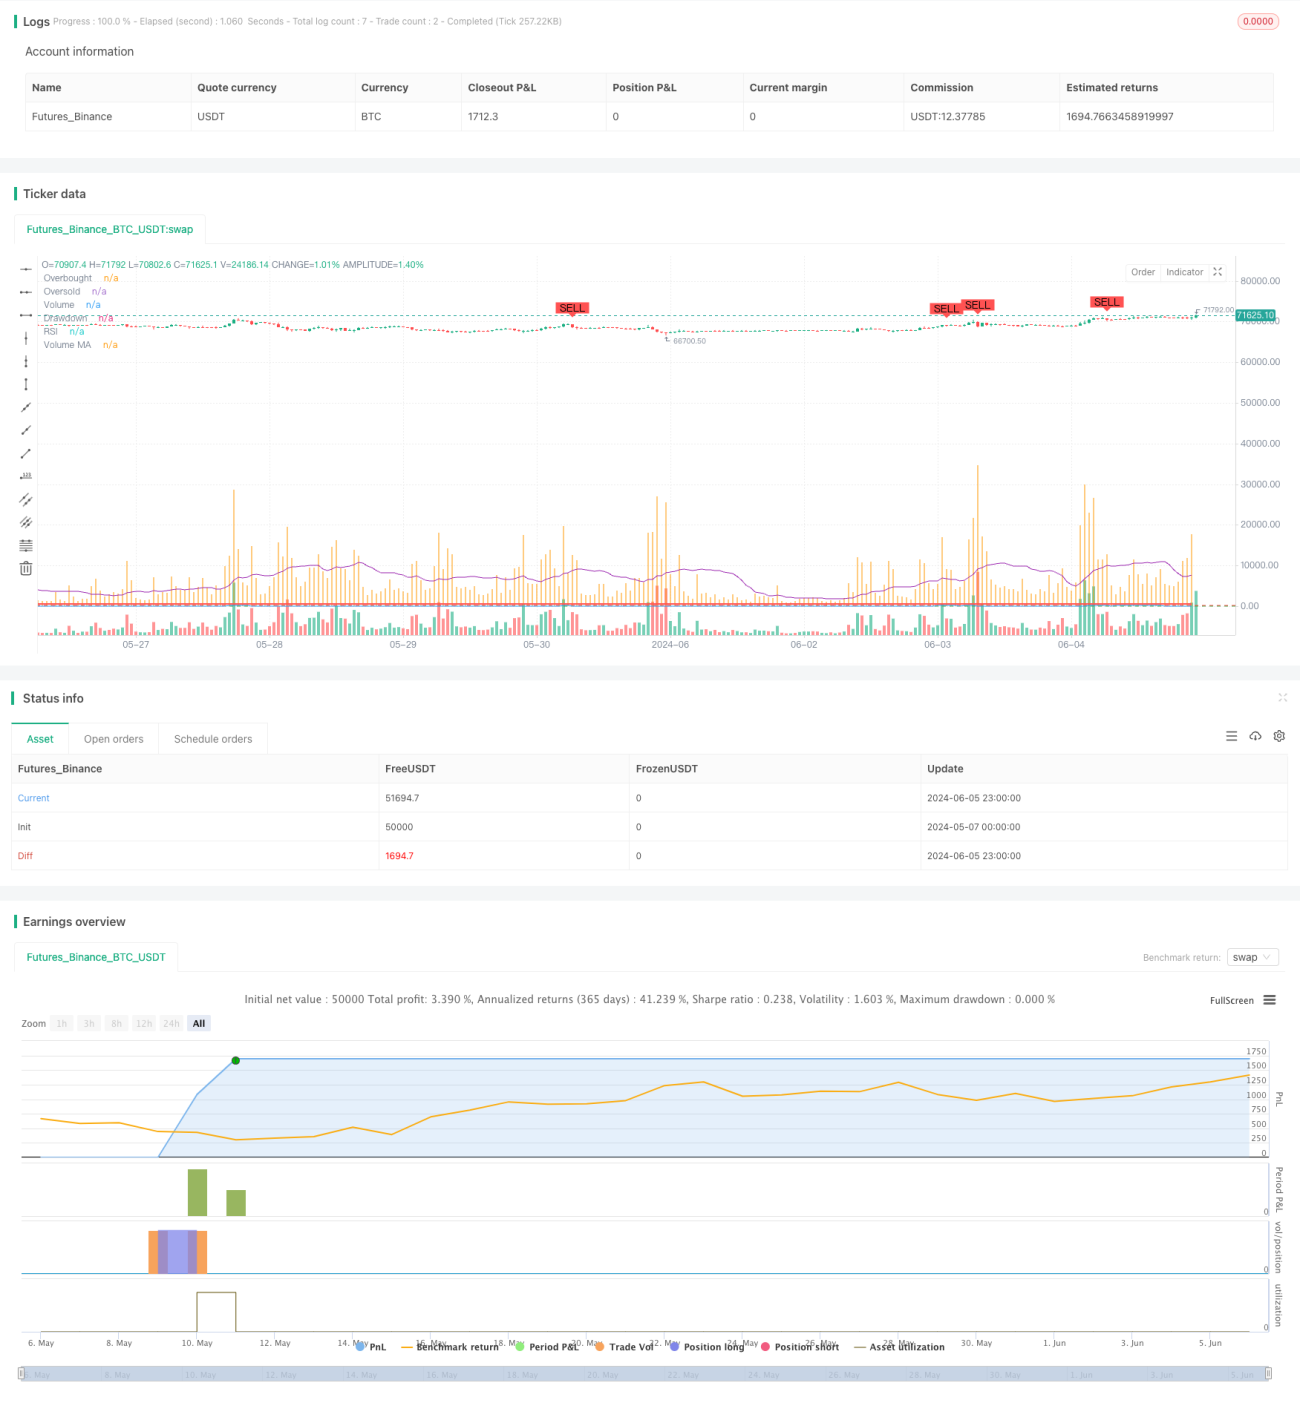
Chiến lược này dựa trên phương pháp Wyckoff, kết hợp chỉ số tương đối mạnh (RSI) và trung bình di chuyển khối lượng giao dịch (Volume MA) để xác định giai đoạn tích lũy và phân bổ của thị trường, tạo ra tín hiệu mua và bán. Đồng thời, chiến lược này sử dụng cơ chế dừng lỗ động, kiểm soát rủi ro bằng cách thiết lập giá trị tháo gỡ tối đa.
Nguyên tắc chiến lược
- Tính toán chỉ số RSI và khối lượng giao dịch trung bình di chuyển.
- Khi RSI đi lên từ khu vực bán tháo và khối lượng giao dịch lớn hơn trung bình di chuyển khối lượng giao dịch, nó được xác định là giai đoạn tích lũy thị trường, tạo ra tín hiệu mua.
- Khi RSI đi xuống từ vùng quá mua và khối lượng giao dịch lớn hơn khối lượng giao dịch di chuyển trung bình, nó được xác định là giai đoạn phân phối thị trường, tạo ra tín hiệu bán.
- Chiến lược đồng thời theo dõi giá trị ròng tối đa và rút tiền hiện tại của tài khoản. Nếu rút tiền hiện tại vượt quá ngưỡng rút tiền tối đa được thiết lập, chiến lược sẽ thanh toán tất cả các vị trí.
- Mua vị trí trong giai đoạn phân phối hoặc rút lui vượt quá mức rút lui tối đa khi đóng cửa, bán vị trí trong giai đoạn tích lũy hoặc rút lui vượt quá mức rút lui tối đa khi đóng cửa.
Lợi thế chiến lược
- Kết hợp với RSI và chỉ số khối lượng giao dịch, nó có thể nắm bắt chính xác hơn giai đoạn tích lũy và phân phối của thị trường.
- Sử dụng cơ chế dừng lỗ rút lui động, bạn có thể kiểm soát hiệu quả rút lui tối đa của chiến lược và giảm rủi ro tổng thể của chiến lược.
- Dữ liệu tần số cao cho 5 phút, phản ứng nhanh với sự thay đổi của thị trường, điều chỉnh vị trí kịp thời.
Rủi ro chiến lược
- RSI và khối lượng giao dịch có thể tạo ra tín hiệu sai lệch trong một số trường hợp thị trường, dẫn đến các quyết định giao dịch sai lầm trong chiến lược.
- Các thiết lập về giá trị rút lui tối đa cần được điều chỉnh theo đặc điểm của thị trường và sở thích rủi ro cá nhân, và các thiết lập không phù hợp có thể dẫn đến chiến lược tháo lỗ quá sớm hoặc chịu rủi ro quá lớn.
- Chiến lược này có thể tạo ra các tín hiệu giao dịch thường xuyên trong thị trường bất ổn, làm tăng chi phí giao dịch.
Hướng tối ưu hóa chiến lược
- Các chỉ số kỹ thuật khác như MACD, Blink và các chỉ số kỹ thuật khác có thể được xem xét để cải thiện độ chính xác tín hiệu của chiến lược.
- Tối ưu hóa các tham số của RSI và khối lượng giao dịch, chẳng hạn như điều chỉnh độ dài RSI, vượt quá ngưỡng mua bán để phù hợp với các tình huống thị trường khác nhau.
- Ngoài việc rút lỗ, bạn có thể tham gia vào các cơ chế dừng lỗ hoặc bảo vệ lợi nhuận để kiểm soát rủi ro và khóa lợi nhuận hơn nữa.
Tóm tắt
Chiến lược dừng lỗ rút động RSI bằng cách kết hợp RSI và chỉ số khối lượng giao dịch, xác định giai đoạn tích lũy và phân bổ của thị trường, đồng thời sử dụng cơ chế dừng lỗ rút động để kiểm soát rủi ro. Chiến lược này có một số tính thực tế trong việc nắm bắt xu hướng thị trường đồng thời quản lý rủi ro. Tuy nhiên, hiệu suất của chiến lược phụ thuộc vào lựa chọn tham số chỉ số và đặc điểm của thị trường, cần phải cải thiện tính ổn định và khả năng sinh lợi của nó thông qua việc tối ưu hóa và điều chỉnh liên tục.
- 1